Fig. 6.
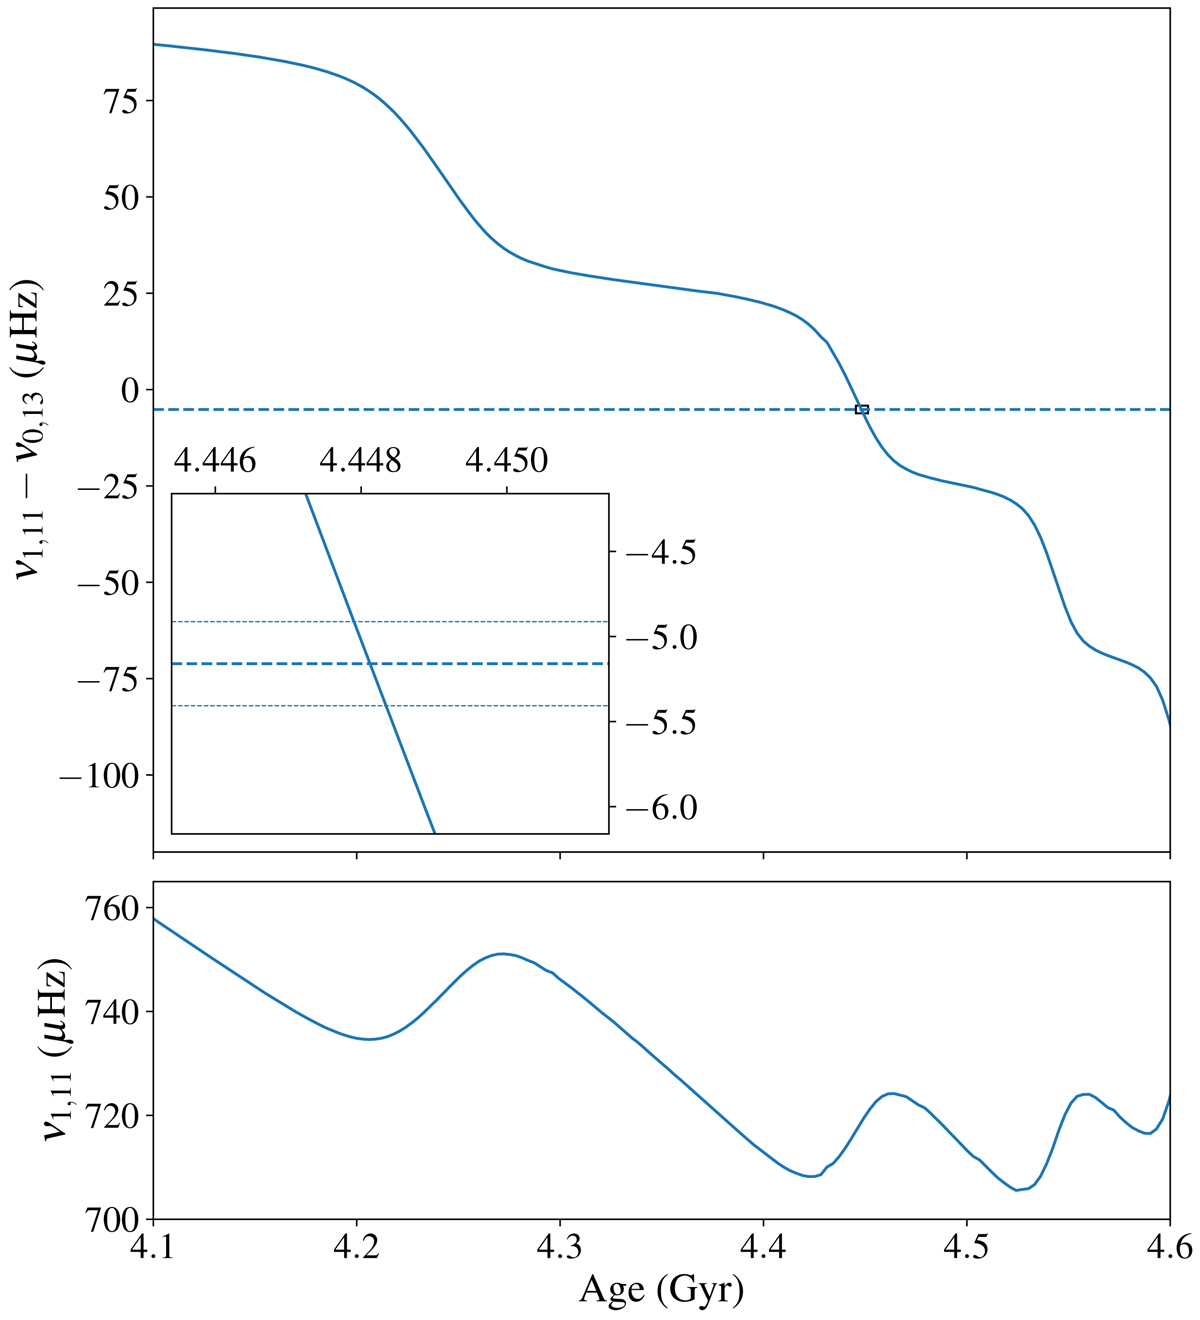
Evolution of δν (top panel) and ν1, 11 (bottom panel) with age for a 1.3 M⊙ star, after the main sequence. Here, like in our modeling of KIC10273246, δν is defined as ν1, 11 − ν0, 13, and the observed value is represented by the dotted line. The plot has been strongly magnified in order to see the 1-σ uncertainties from the data.
Current usage metrics show cumulative count of Article Views (full-text article views including HTML views, PDF and ePub downloads, according to the available data) and Abstracts Views on Vision4Press platform.
Data correspond to usage on the plateform after 2015. The current usage metrics is available 48-96 hours after online publication and is updated daily on week days.
Initial download of the metrics may take a while.