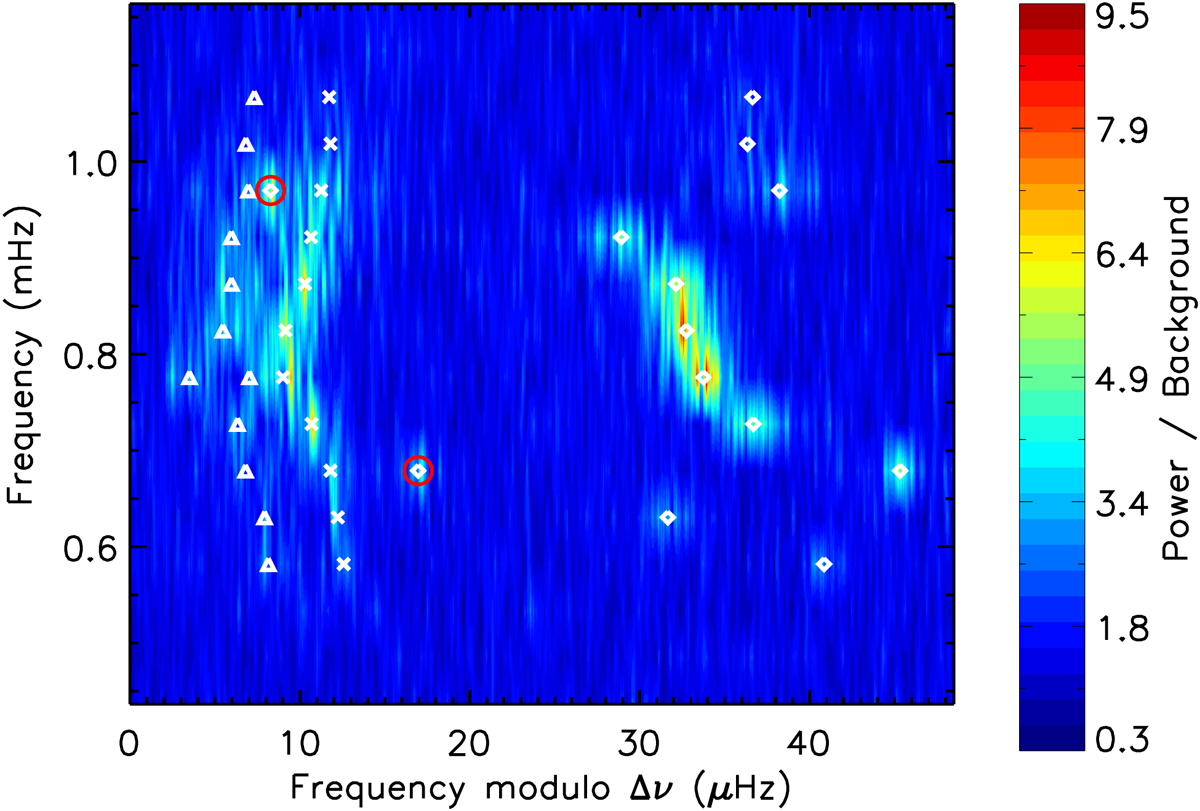
Fig. 3.

Échelle diagram of KIC10273246, folded with Δν = 48.2 μHz. For clarity, the spectrum was smoothed over a 0.2-μHz boxcar. The white symbols indicate the frequencies that have been extracted for modes of degree l = 0 (crosses), l = 1 (diamonds), and l = 2 (triangles) in Sect. 3.2.2. The two l = 1 g-dominated mixed modes are circled in red.
Current usage metrics show cumulative count of Article Views (full-text article views including HTML views, PDF and ePub downloads, according to the available data) and Abstracts Views on Vision4Press platform.
Data correspond to usage on the plateform after 2015. The current usage metrics is available 48-96 hours after online publication and is updated daily on week days.
Initial download of the metrics may take a while.


