Fig. 12.
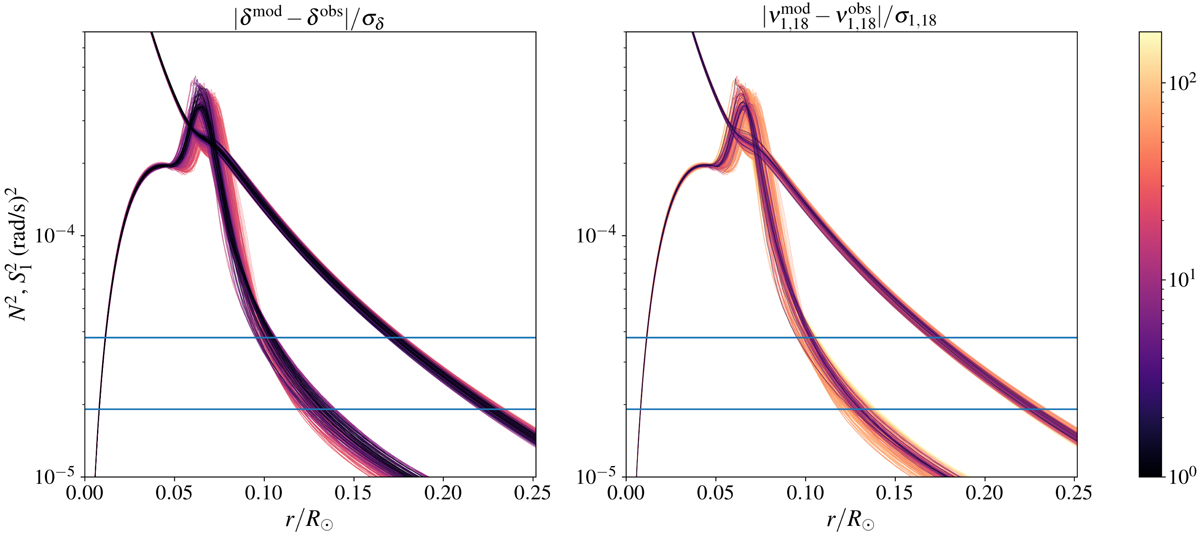
N2 profiles of the loose grid models. The left and right panel profiles are colored in relation to the difference between the models and the observations of ν1, 18 and δ, respectively. Those differences are normalized by the observational uncertainties. The blue horizontal lines represent the observed g-dominated frequencies.
Current usage metrics show cumulative count of Article Views (full-text article views including HTML views, PDF and ePub downloads, according to the available data) and Abstracts Views on Vision4Press platform.
Data correspond to usage on the plateform after 2015. The current usage metrics is available 48-96 hours after online publication and is updated daily on week days.
Initial download of the metrics may take a while.