Fig. 1.
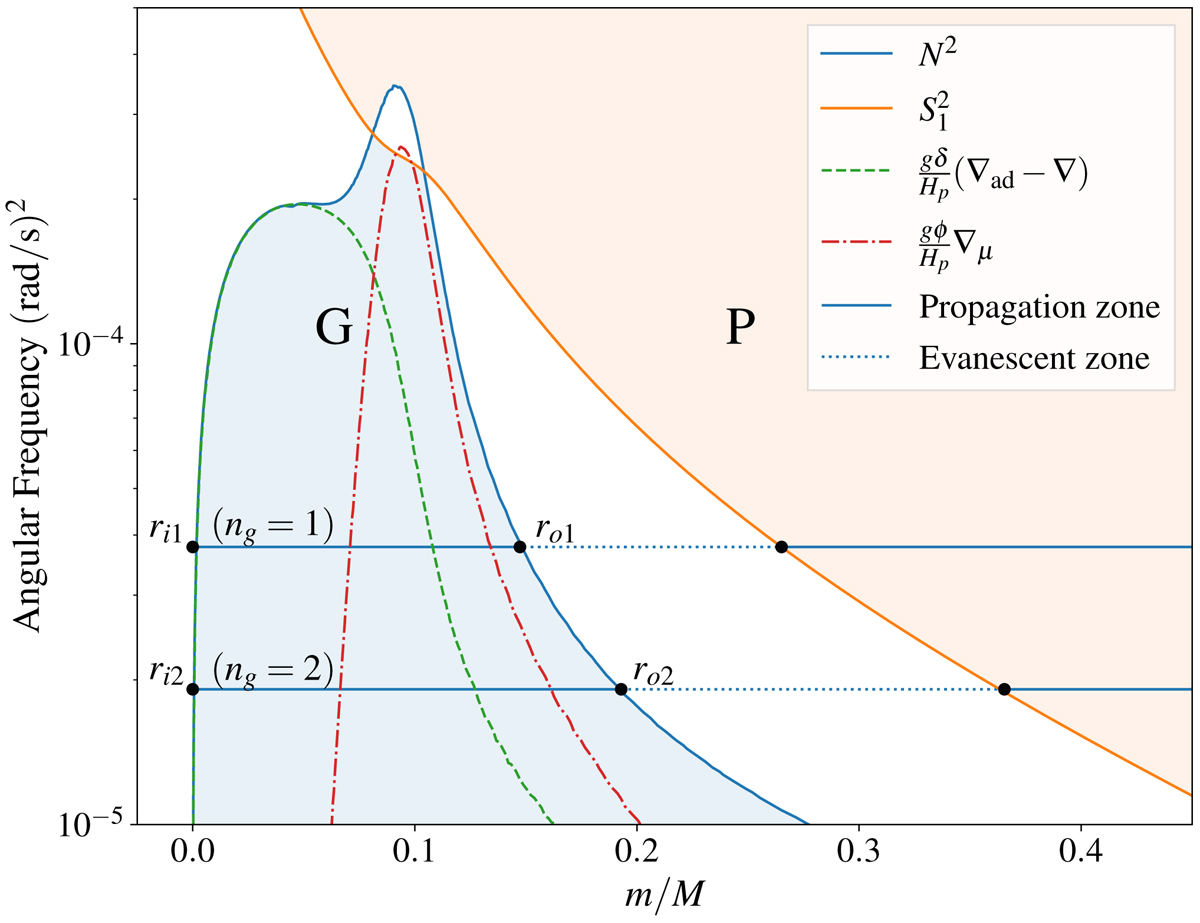
Typical propagation diagram of a low-mass subgiant star. The Brunt-Väisälä frequency is represented in blue, delimiting the g-mode cavity (light blue). The Lamb frequency, in orange, delimits the p-mode cavity (light orange). Two g-dominated mixed mode angular frequencies, with ng = 1, 2, are represented (solid lines in propagation zones, dotted lines in evanescent zones). The G cavity turning points are noted as ri1, ri2 and ro1, ro2. Finally, the thermal and chemical contributions to the Brunt-Väisälä frequency are represented in green (dashed) and red (dot-dashed), respectively.
Current usage metrics show cumulative count of Article Views (full-text article views including HTML views, PDF and ePub downloads, according to the available data) and Abstracts Views on Vision4Press platform.
Data correspond to usage on the plateform after 2015. The current usage metrics is available 48-96 hours after online publication and is updated daily on week days.
Initial download of the metrics may take a while.