Fig. 9.
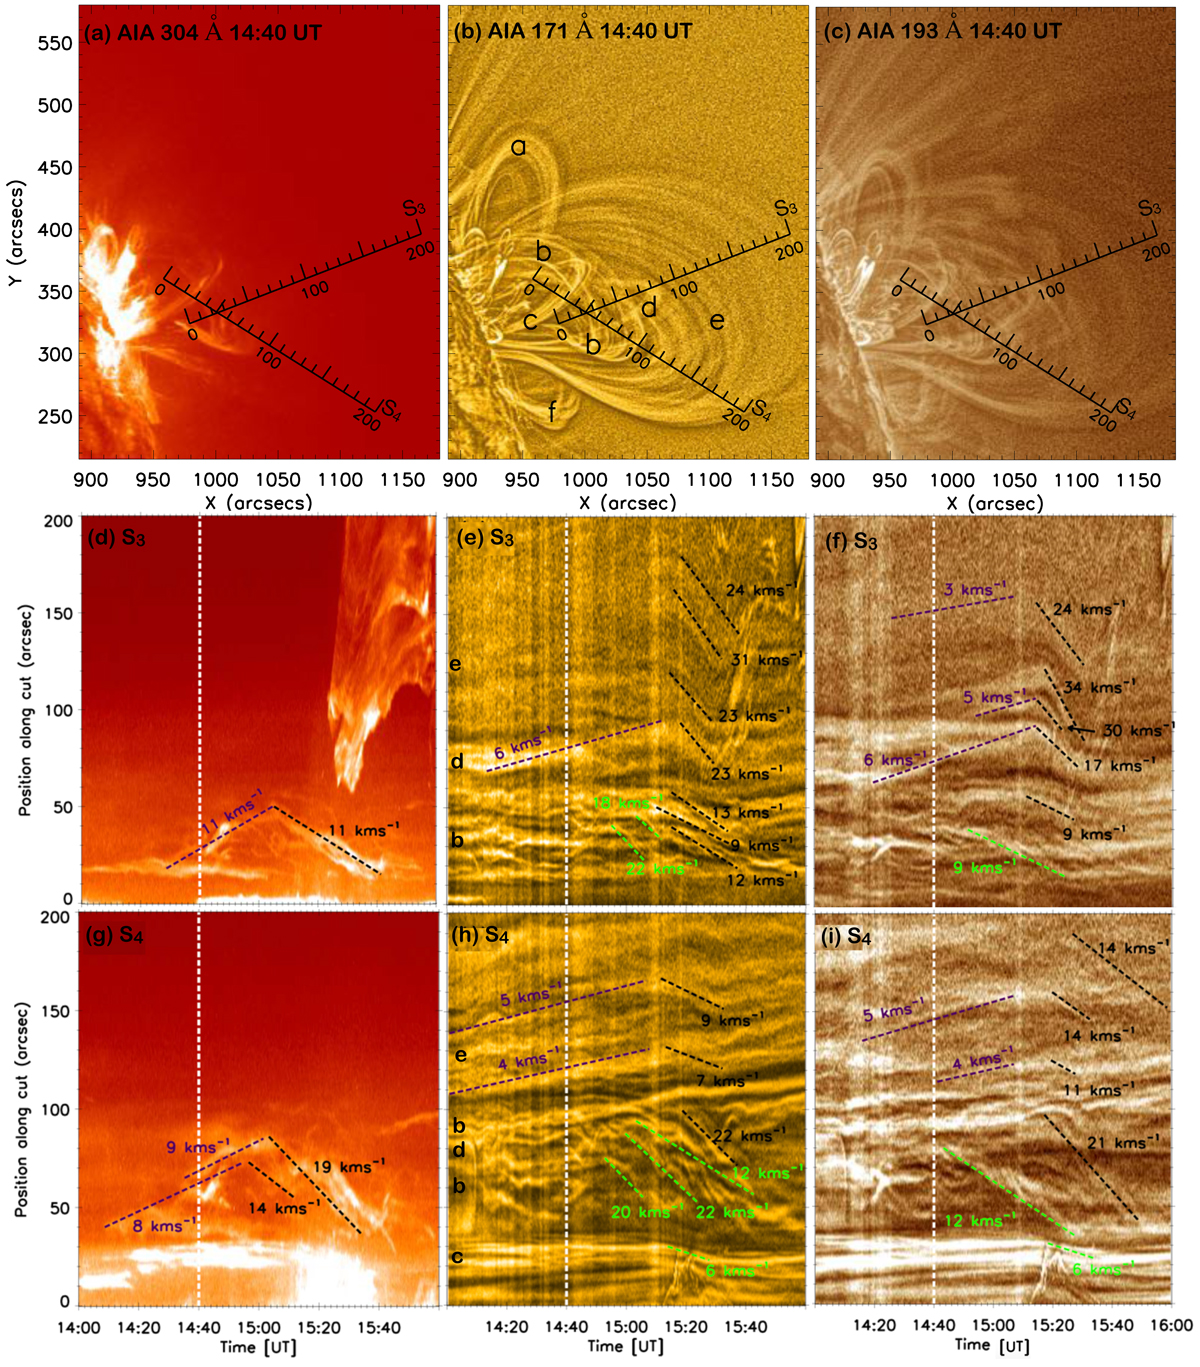
Location of slices S3 and S4 (top row) chosen for the time-distance analysis of AIA 304, 171, and 193 Å presented in the panels a–c, respectively. These slices were selected for the analysis of loop expansion and contraction. Different expanding and contracting loops are shown by dashed lines in the middle and bottom rows. The white vertical dashed line indicates the onset time of the eruption and the time of the top row images. The loop systems in the direction of slices S3 and S4 are labeled in panels e and h, respectively. A movie of AIA 304 Å is available online.
Current usage metrics show cumulative count of Article Views (full-text article views including HTML views, PDF and ePub downloads, according to the available data) and Abstracts Views on Vision4Press platform.
Data correspond to usage on the plateform after 2015. The current usage metrics is available 48-96 hours after online publication and is updated daily on week days.
Initial download of the metrics may take a while.