Fig. 8.
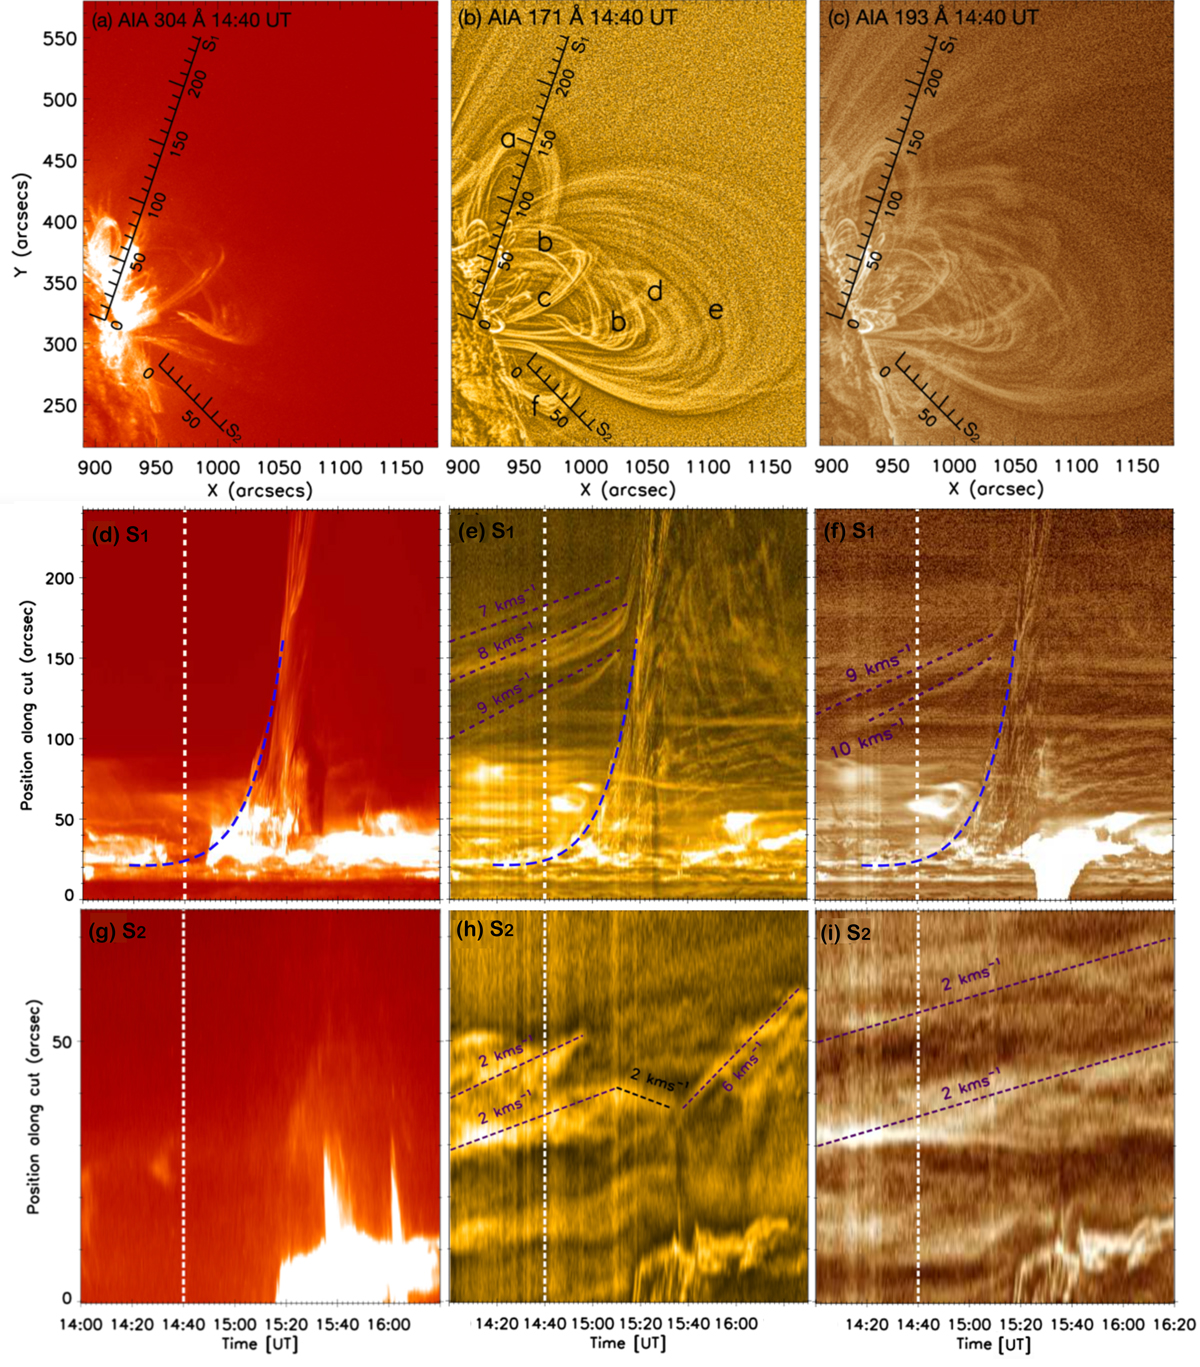
Location of slices S1 and S2 (top row) chosen for the time-distance analysis of AIA 304 (a), 171 (b), and 193 (c) Å. The time-distance plots for slice S1 and S2 are presented in the middle and the bottom rows, respectively, in AIA 304, 171, and 193 Å. The blue dashed line in panels d–f is the fit of a combination of a linear and exponential function to the trajectory shown in the time slice data. The vertical white dashed line in the time-distance plots indicates the onset time of the prominence eruption and also the time of the images shown in the top row. Slice S1 was selected in the direction of the prominence eruption so that the erupting plasma would be clearly visible in the time-distance image (middle row). Slice S2 was selected on the opposite side of the AR from the eruption region to explore the extension of the eruption effects. A movie of AIA 304, 171, and 193 Å is available online.
Current usage metrics show cumulative count of Article Views (full-text article views including HTML views, PDF and ePub downloads, according to the available data) and Abstracts Views on Vision4Press platform.
Data correspond to usage on the plateform after 2015. The current usage metrics is available 48-96 hours after online publication and is updated daily on week days.
Initial download of the metrics may take a while.