Fig. 6.
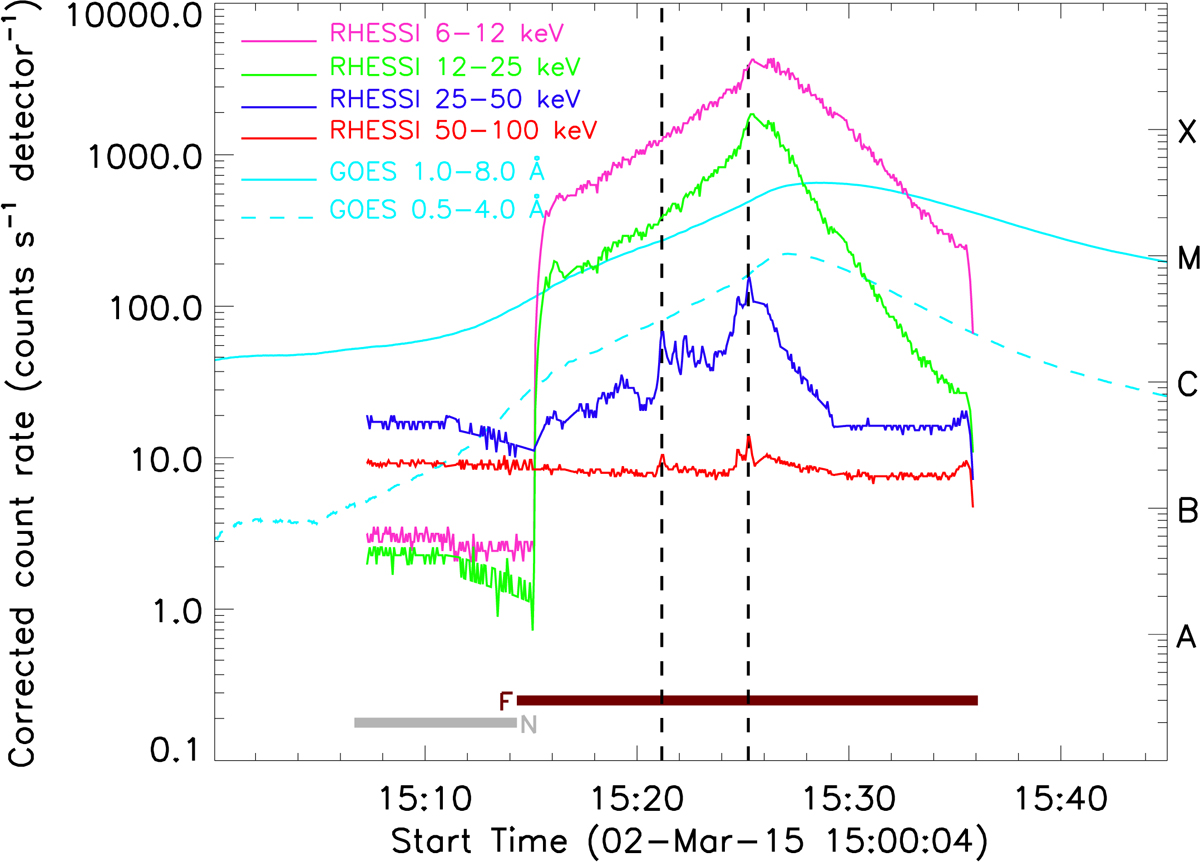
GOES and RHESSI X-ray time profiles of the M3.7 flare. For RHESSI, profiles were plotted in the energy bands of 6−12 keV (pink), 12−25 keV (green), 25−50 keV (blue), and 50−100 keV (red). For clarity of presentation, we scaled RHESSI count rates by factors of 1, 1/2, 1, and 1/5 for 6−12 keV, 12−25 keV, 25−50 keV, and 50−100 keV energy bands, respectively. RHESSI light curves were corrected for change in attenuator states during flare observations. Horizontal bars at the bottom represent the RHESSI observing state (N: night; F: flare).
Current usage metrics show cumulative count of Article Views (full-text article views including HTML views, PDF and ePub downloads, according to the available data) and Abstracts Views on Vision4Press platform.
Data correspond to usage on the plateform after 2015. The current usage metrics is available 48-96 hours after online publication and is updated daily on week days.
Initial download of the metrics may take a while.