Fig. 3.
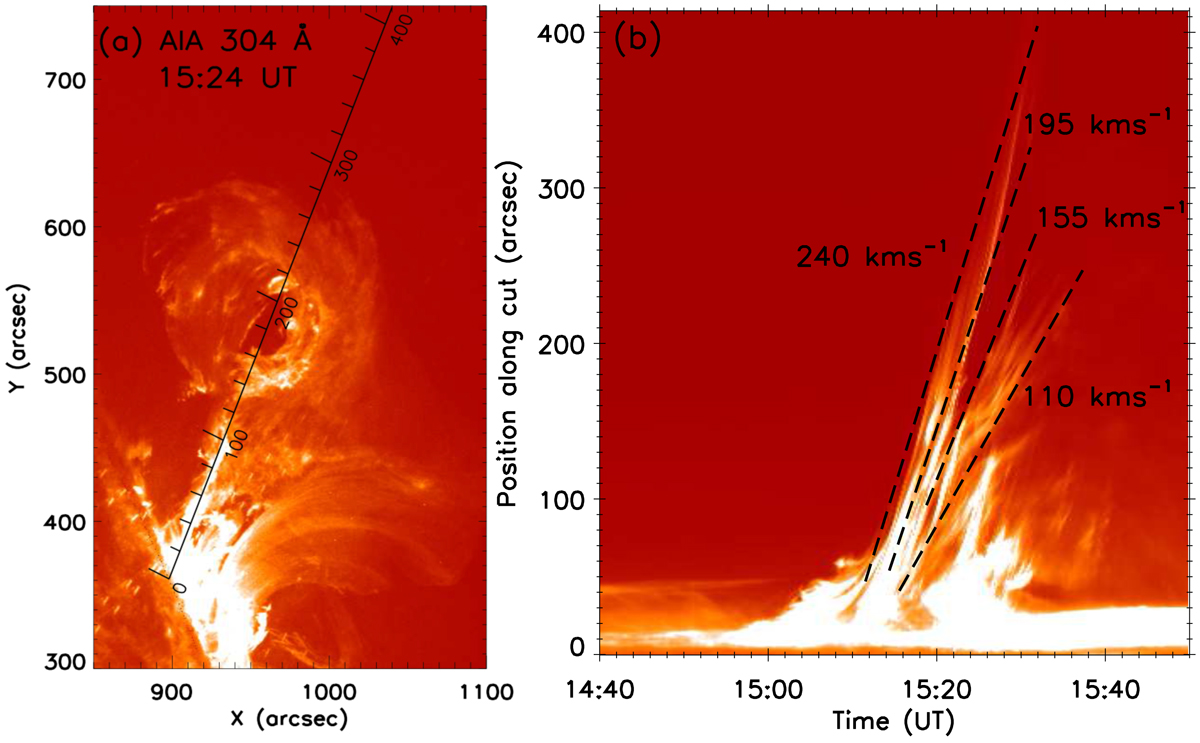
a: AIA 304 Å image showing the ejected plasma and the position of the selected slice. b: time-distance plot along the selected slice. When the emission is less saturated and the spatial extension large enough, the erupting plasma has a range of velocities as displayed with over-plotted straight lines approximating the mean plasma blob trajectories (velocities are still increasing with time). This outlines the global expansion of the FR.
Current usage metrics show cumulative count of Article Views (full-text article views including HTML views, PDF and ePub downloads, according to the available data) and Abstracts Views on Vision4Press platform.
Data correspond to usage on the plateform after 2015. The current usage metrics is available 48-96 hours after online publication and is updated daily on week days.
Initial download of the metrics may take a while.