Fig. 2.
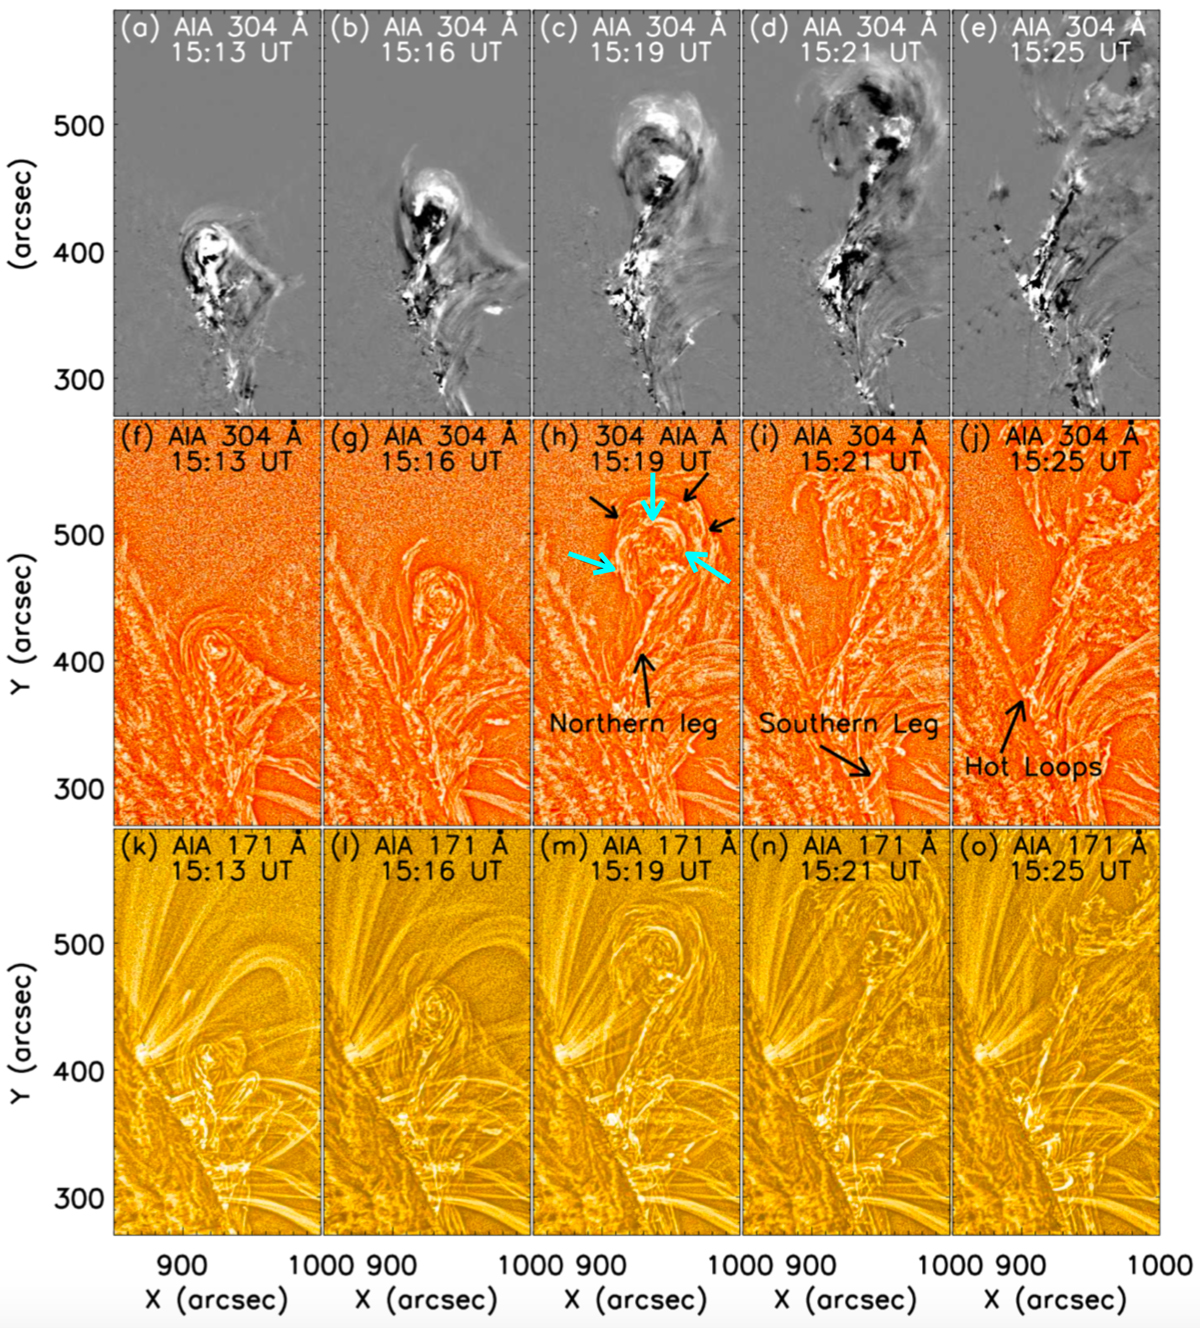
Spatial evolution of the eruption using the running difference method (a–e) and with MGN processed images of the prominence eruption in AIA 304 (f–j) and 171 (k–o) Å wavelengths (see Sect. 2.1). The northern and southern legs of the filament are indicated by arrows in panels h and i, respectively. The flare loops represented by “hot loops” are shown in panel j. The black and cyan arrows in panel h show the outer and inner quasi circular features which is the FR configuration. See online movies.
Current usage metrics show cumulative count of Article Views (full-text article views including HTML views, PDF and ePub downloads, according to the available data) and Abstracts Views on Vision4Press platform.
Data correspond to usage on the plateform after 2015. The current usage metrics is available 48-96 hours after online publication and is updated daily on week days.
Initial download of the metrics may take a while.