Fig. 1.
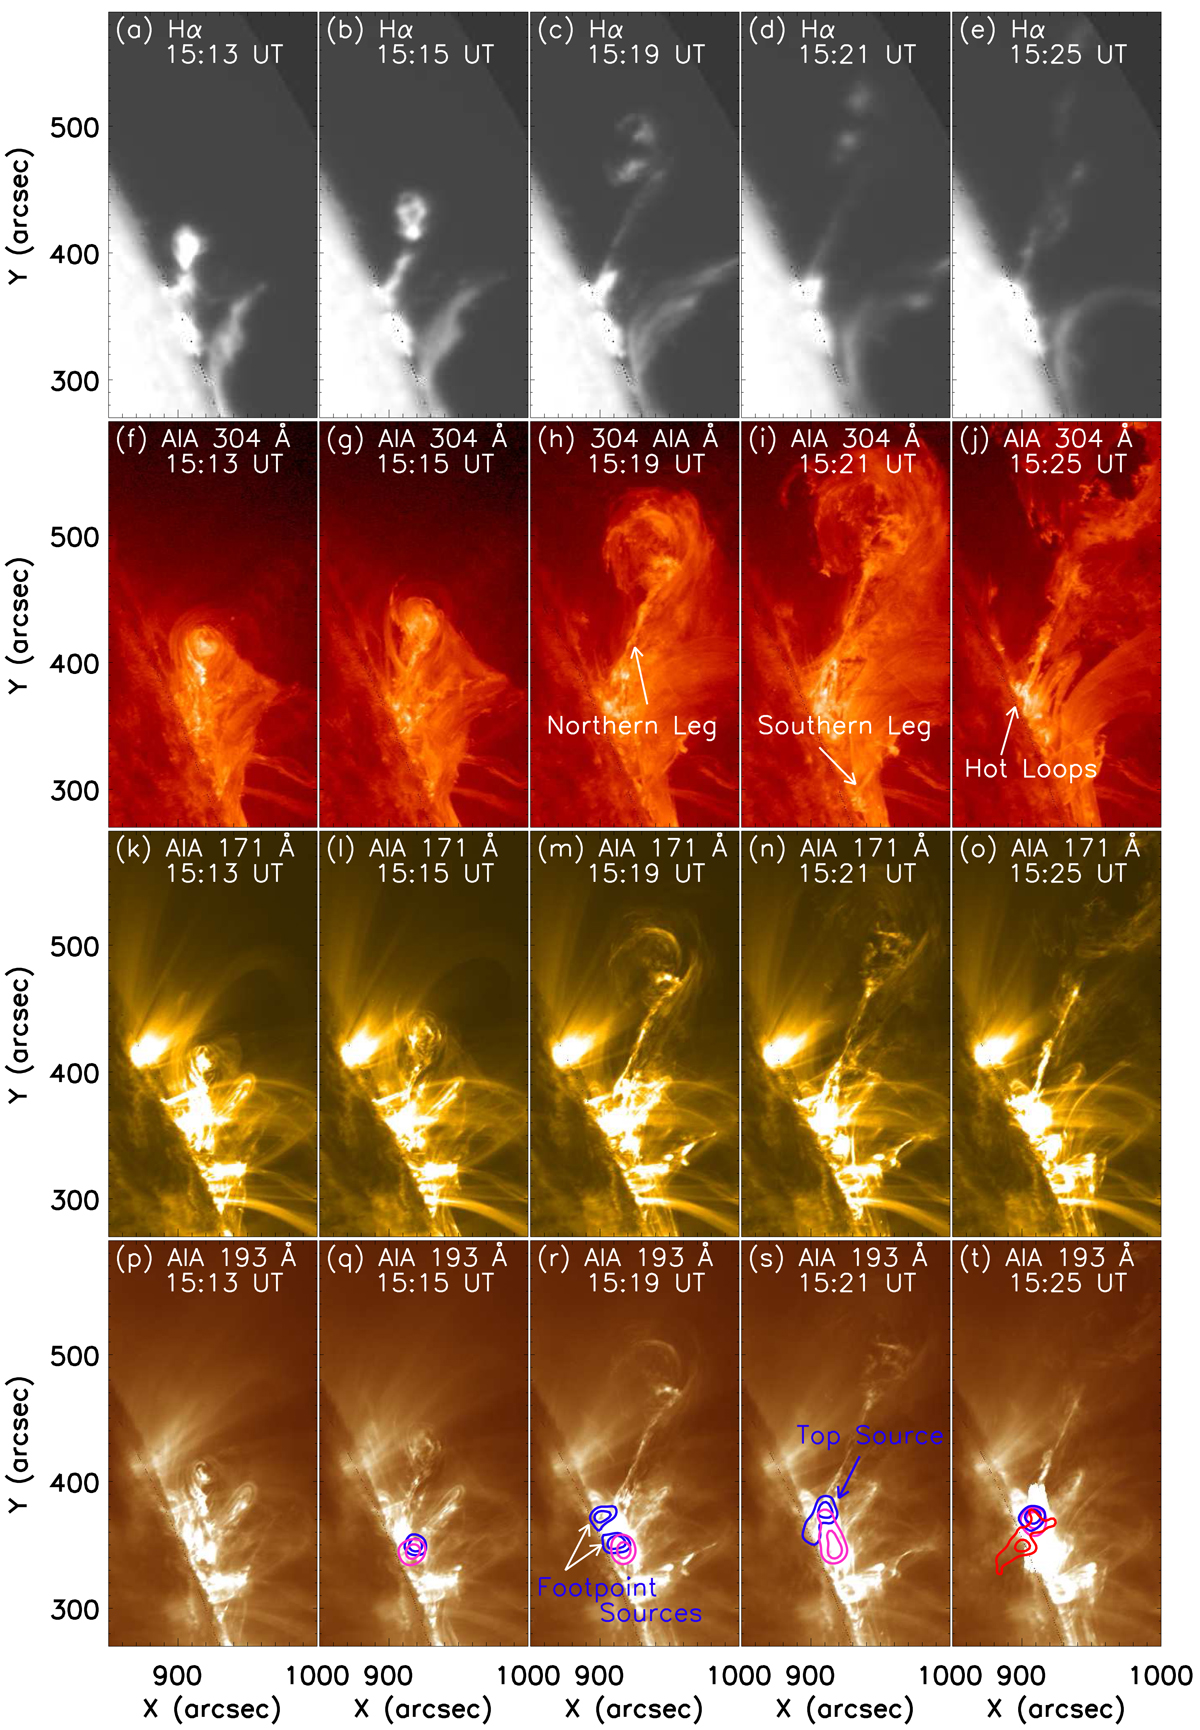
Spatial evolution of the prominence eruption observed in GONG Hα (a–e), AIA 304 (f–j), 171 (k–o), and 193 (p–t) Å wavelengths (see online movies). The onset of the eruption is ≈14:40 UT. The northern and southern legs of the filament are labeled as the “Northern Leg” and “Southern Leg” in panels h and i, respectively. RHESSI X-ray contours of 6−12 (pink), 25−50 (blue), and 50−100 keV (red) energy ranges were over-plotted on AIA 193 Å images in panels q–t. The contour levels were set to 50% and 80% of the peak flux of the X-ray flux peak. The integration time for RHESSI images is 20 s.
Current usage metrics show cumulative count of Article Views (full-text article views including HTML views, PDF and ePub downloads, according to the available data) and Abstracts Views on Vision4Press platform.
Data correspond to usage on the plateform after 2015. The current usage metrics is available 48-96 hours after online publication and is updated daily on week days.
Initial download of the metrics may take a while.