Fig. 9.
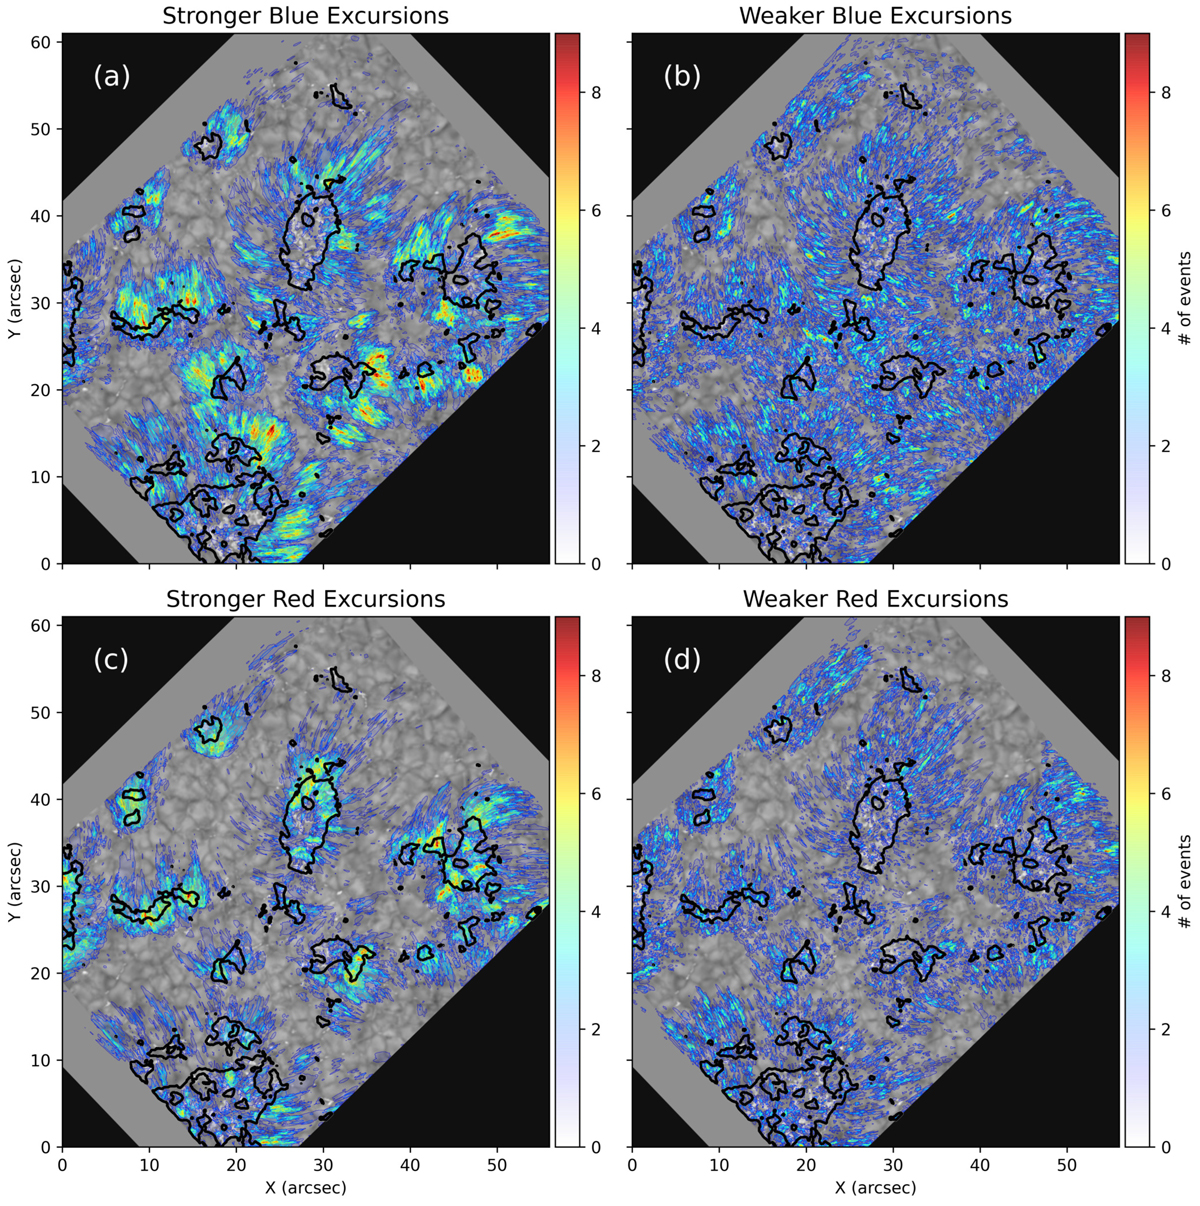
Spatial occurrence of the stronger and weaker blue and red excursions with respect to the strong field network regions. Panels a and b: stronger and weaker blue shifted excursions (RBEs) whereas panels c and d: distribution of the stronger and weaker red shifted excursions (RREs/downflowing RREs), respectively. The colors represent the number density of the events shown. The events are mutually exclusive, meaning that the excursions shown in any one panel are unique and are not related to the events in the other. The black contour indicates the regions with an absolute LOS magnetic field ≥100 G.
Current usage metrics show cumulative count of Article Views (full-text article views including HTML views, PDF and ePub downloads, according to the available data) and Abstracts Views on Vision4Press platform.
Data correspond to usage on the plateform after 2015. The current usage metrics is available 48-96 hours after online publication and is updated daily on week days.
Initial download of the metrics may take a while.