Fig. 8.
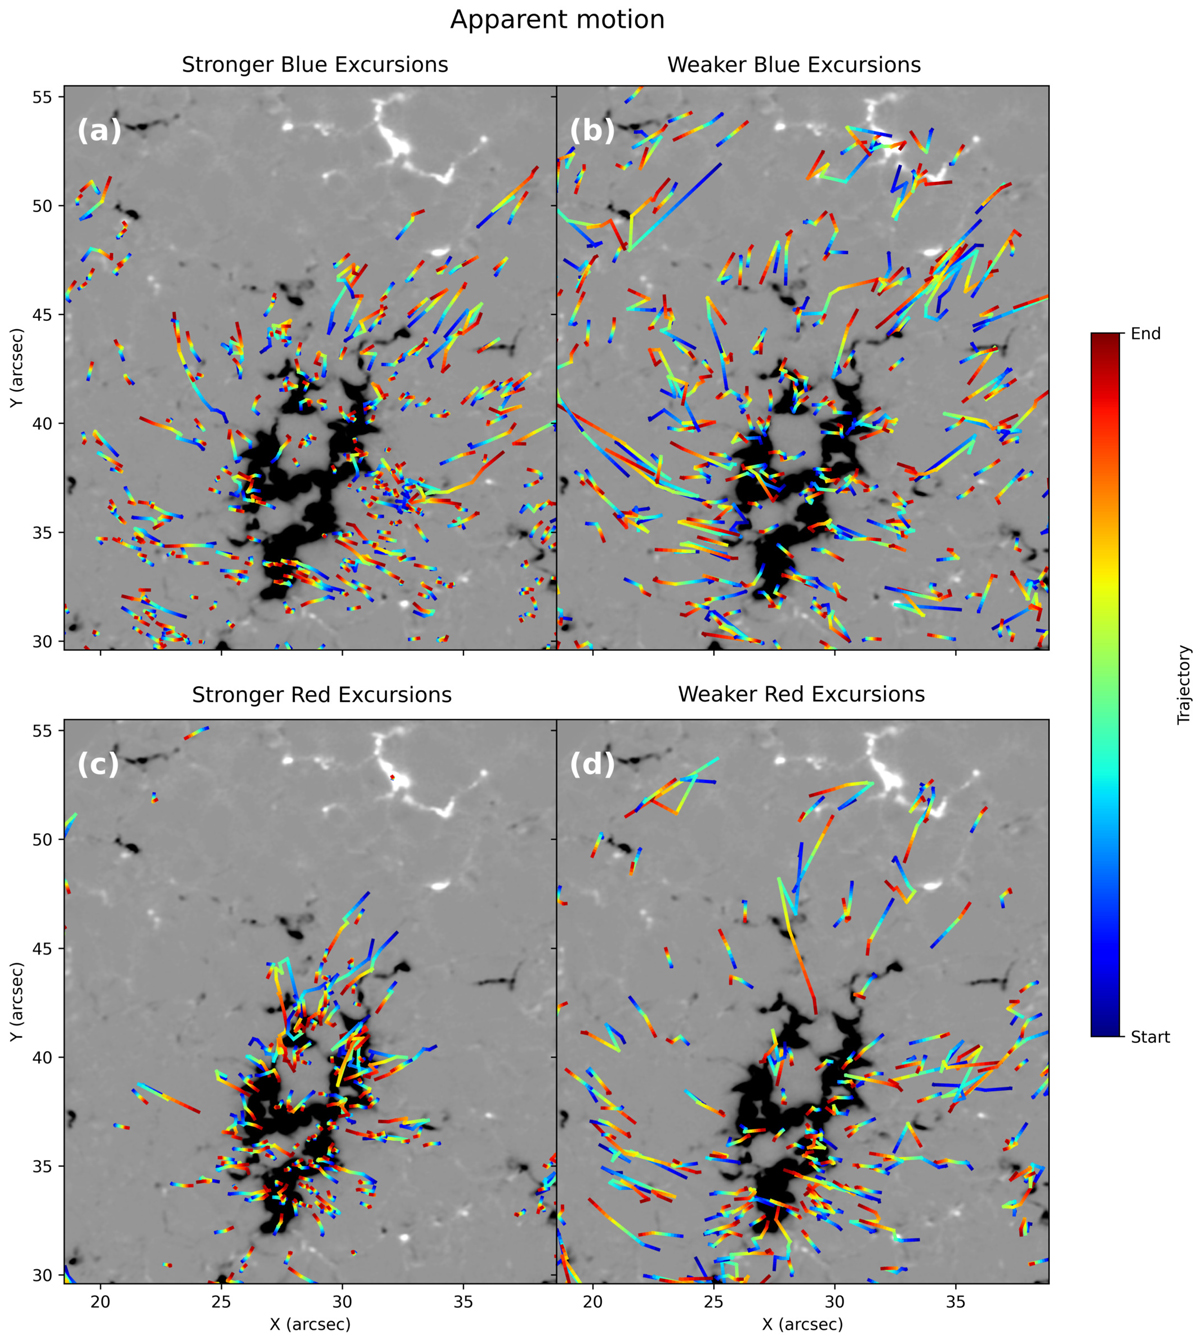
Plane-of-sky trajectories of RBEs, RREs and downflowing RREs mapped according to the strength of their excursions towards the blue (top row) and red (bottom row) wings. The background shows a BLOS map saturated between ±500 G. The rainbow colored trajectories map the travel direction from the origin in blue to the termination in red. Here, only a zoom in on a network patch is shown, Fig. B.3 shows the full FOV.
Current usage metrics show cumulative count of Article Views (full-text article views including HTML views, PDF and ePub downloads, according to the available data) and Abstracts Views on Vision4Press platform.
Data correspond to usage on the plateform after 2015. The current usage metrics is available 48-96 hours after online publication and is updated daily on week days.
Initial download of the metrics may take a while.