Fig. 5.
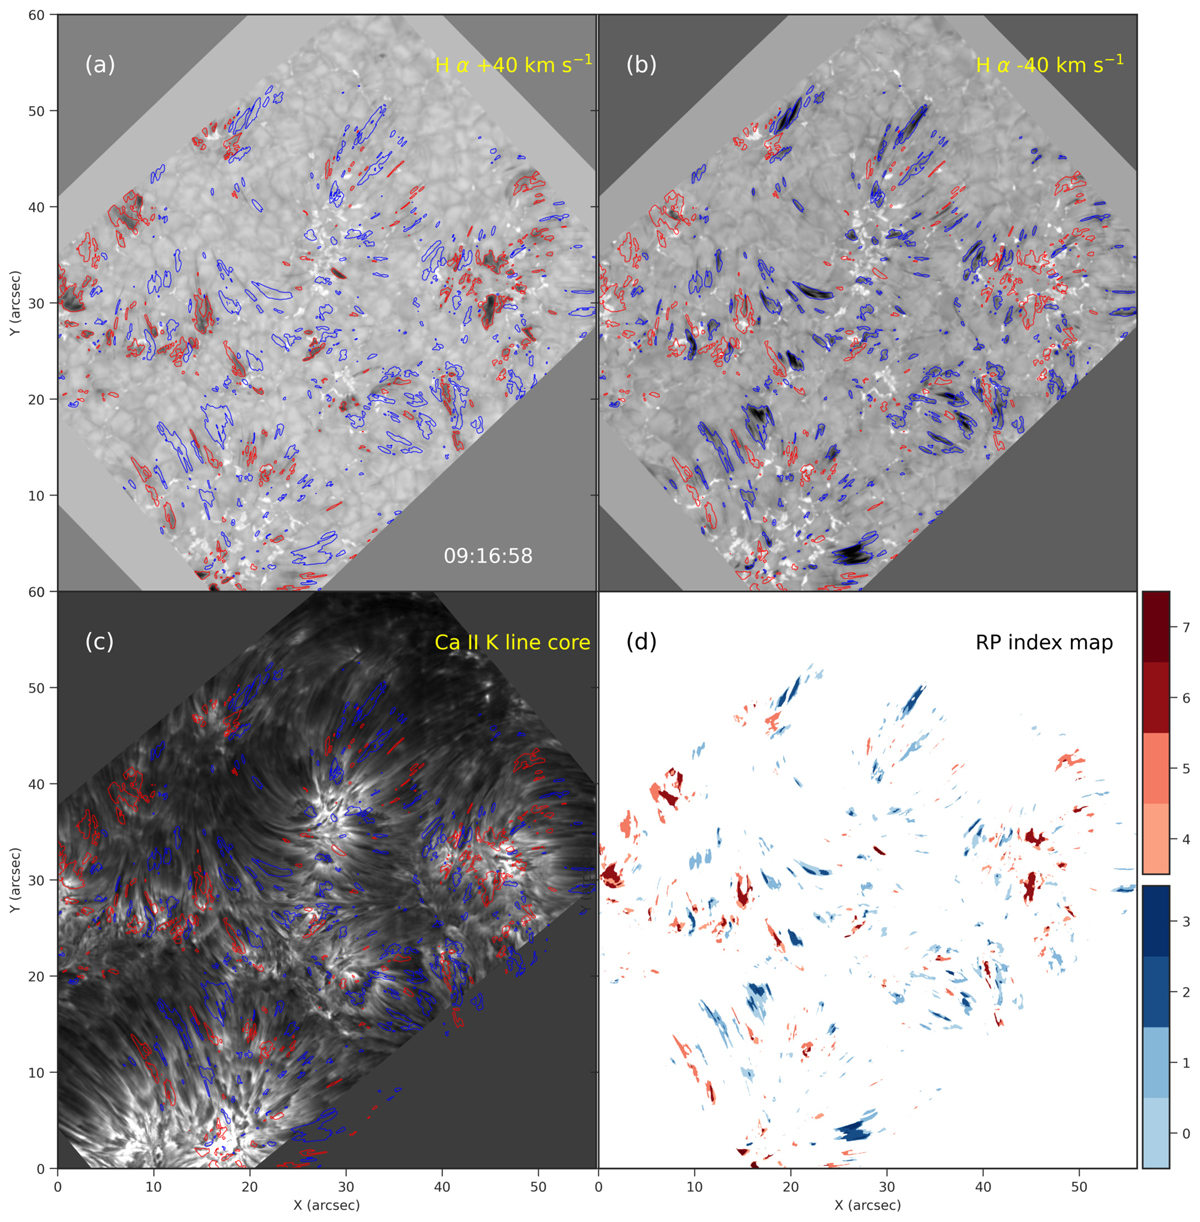
Overview of the detected RBEs and RREs/downflowing RREs in Hα wing and Ca II K. Panels a–c: RBEs and their associated substructures (halos) in blue and RREs/downflowing RREs and their halos in red colored contours against a background of Hα wing images at +40 km s−1, −40 km s−1 and Ca II K line core, respectively at time t = 09:17 UT. Panel d: corresponding RP index map with gradients in the color indicating the contribution from the different RPs as shown in the colorbar. An animation of this figure is available online.
Current usage metrics show cumulative count of Article Views (full-text article views including HTML views, PDF and ePub downloads, according to the available data) and Abstracts Views on Vision4Press platform.
Data correspond to usage on the plateform after 2015. The current usage metrics is available 48-96 hours after online publication and is updated daily on week days.
Initial download of the metrics may take a while.