Fig. 4.
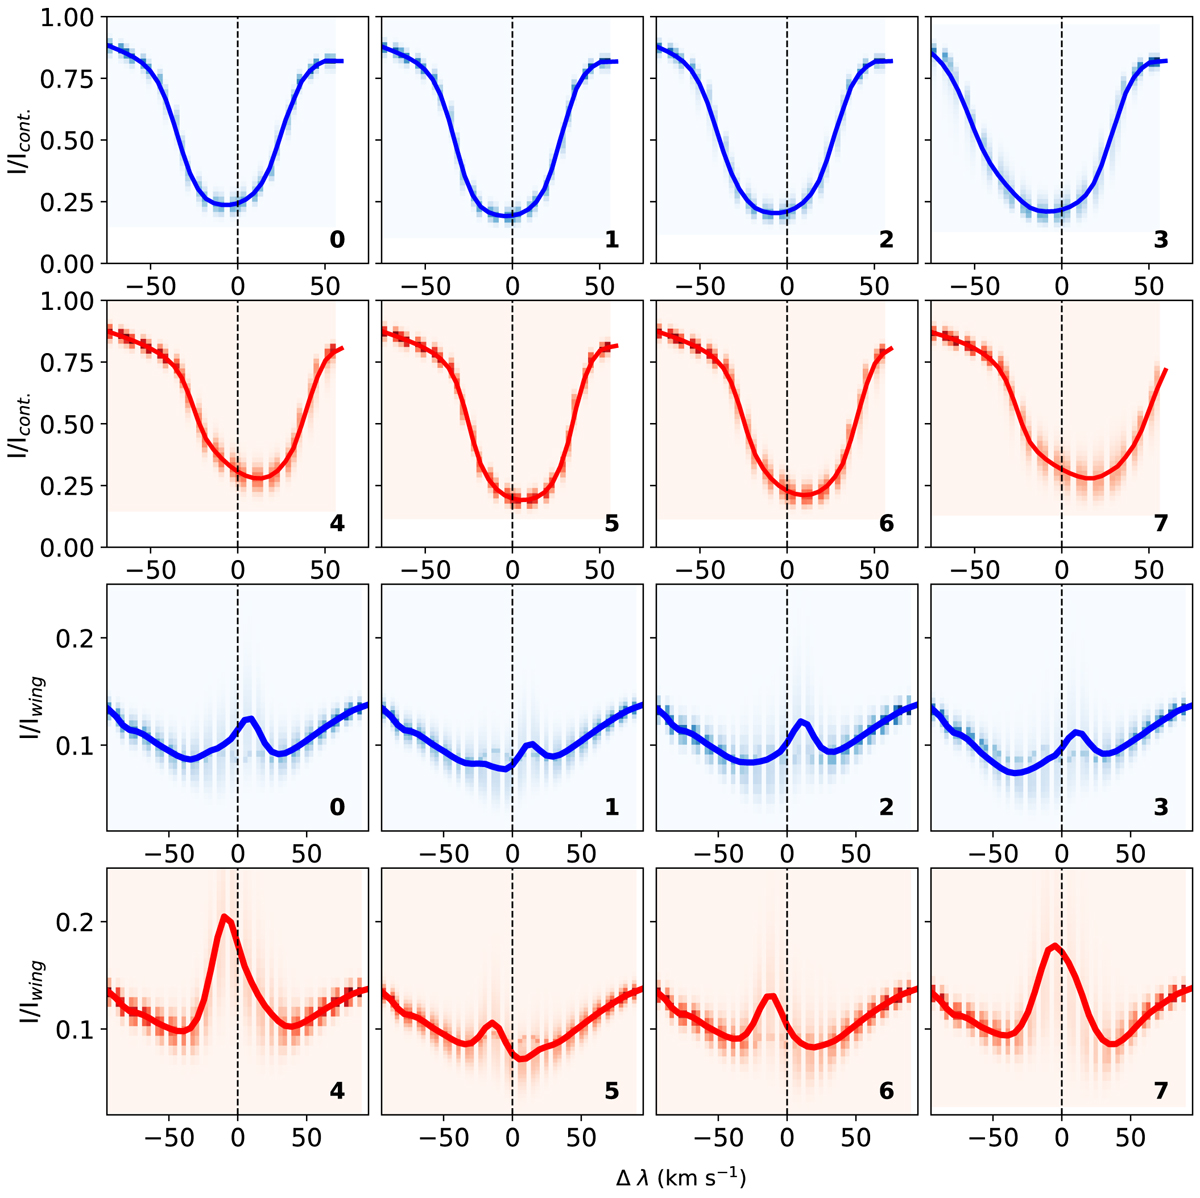
Density plots of the Hα (top two rows) and Ca II K (bottom two rows) spectra for RBE and RRE/downflowing RRE RPs (0–7). The density (darker meaning higher concentration of spectra) corresponding to each RPs shows the distribution of profiles over the whole time series. The solid lines overplotted correspond to the RPs discussed in the text. The blue (red) color coding indicates the excursions in the blue ward (red ward) side of Hα respectively.
Current usage metrics show cumulative count of Article Views (full-text article views including HTML views, PDF and ePub downloads, according to the available data) and Abstracts Views on Vision4Press platform.
Data correspond to usage on the plateform after 2015. The current usage metrics is available 48-96 hours after online publication and is updated daily on week days.
Initial download of the metrics may take a while.