Free Access
Fig. 3.
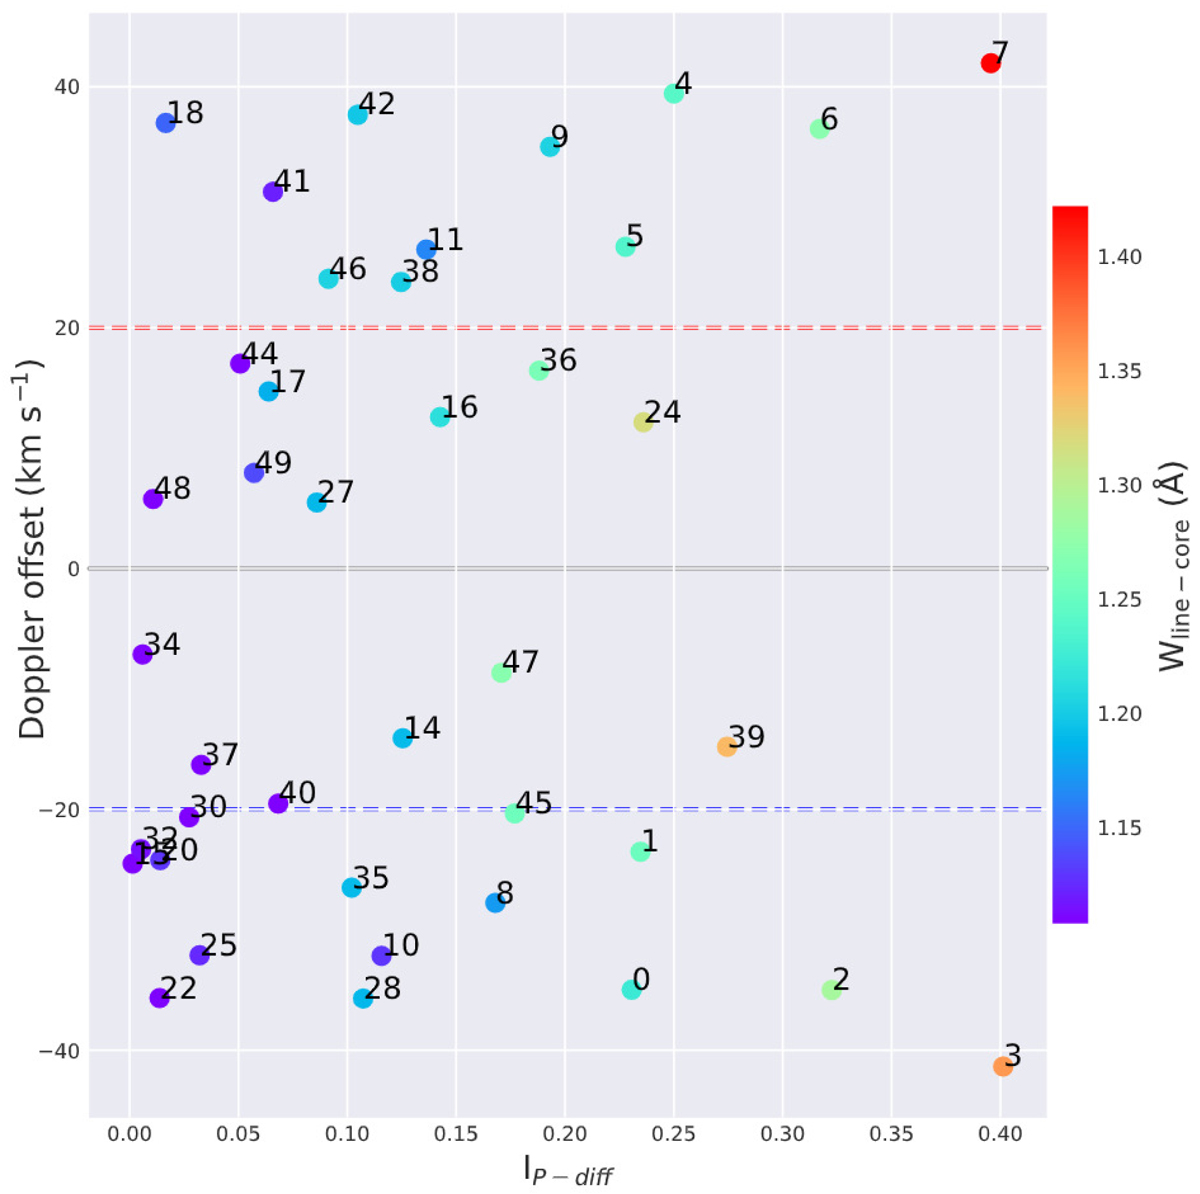
Scatter plot between the COG Doppler offsets and the peak intensity (IP − diff) of the differential profiles for all RPs. The points are annotated with the respective RP index and color coded based on the Hα line-core width. The horizontal dashed red and blue lines indicate a Doppler offset of ±20 km s−1 as a reference.
Current usage metrics show cumulative count of Article Views (full-text article views including HTML views, PDF and ePub downloads, according to the available data) and Abstracts Views on Vision4Press platform.
Data correspond to usage on the plateform after 2015. The current usage metrics is available 48-96 hours after online publication and is updated daily on week days.
Initial download of the metrics may take a while.