Fig. 2.
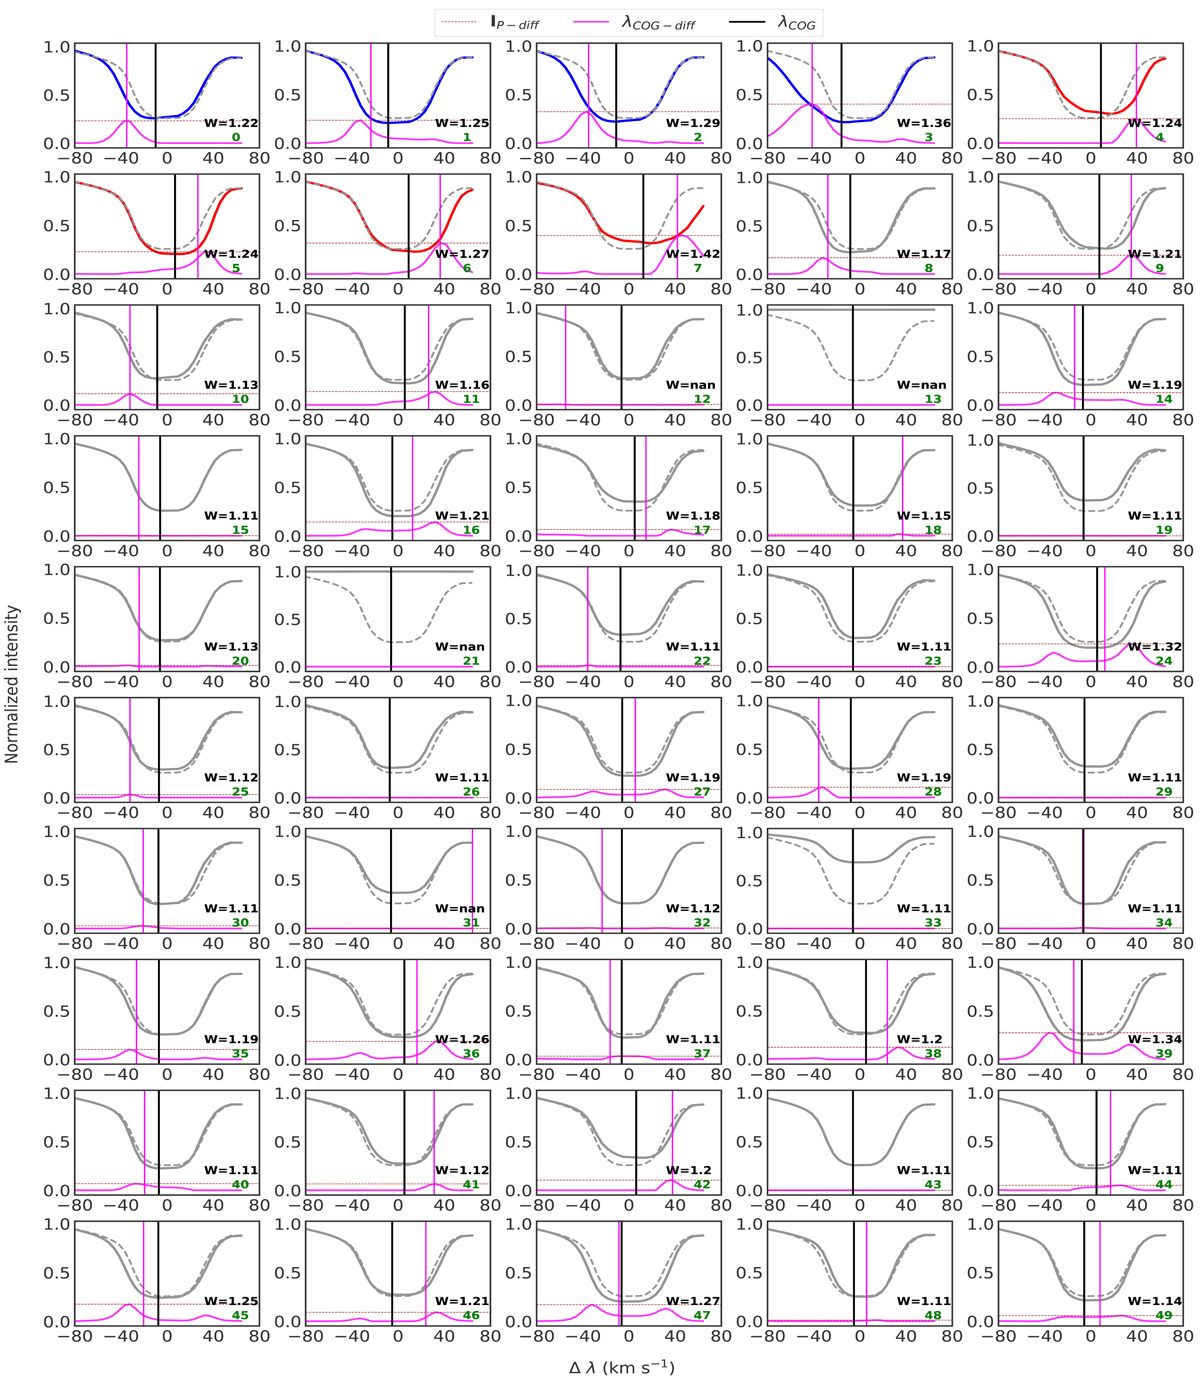
All 50 RPs of Hα spectral lines considered in the final configuration of the k-means algorithm. The RP number is indicated in the lower right corner. RPs 0–3 are colored in blue signifying blue-ward excursions whereas 4–7 are colored in red indicating red-ward excursions. The remaining RPs (8–49) are drawn in gray. The dashed gray spectral line in each of the panels shows the mean Hα profile averaged over the entire data set and serves as reference. The magenta profiles show the positive part of the difference between the mean Hα profile and the respective RP in each panel. The dashed horizontal magenta line marks the level of the peak (IP − diff) of the differential profiles, and the vertical solid magenta line marks the COG Doppler offset of the positive value of the differential profiles (λCOG − diff). The width W of the Hα line core is given for each RP in Å.
Current usage metrics show cumulative count of Article Views (full-text article views including HTML views, PDF and ePub downloads, according to the available data) and Abstracts Views on Vision4Press platform.
Data correspond to usage on the plateform after 2015. The current usage metrics is available 48-96 hours after online publication and is updated daily on week days.
Initial download of the metrics may take a while.