Free Access
Fig. B.4.
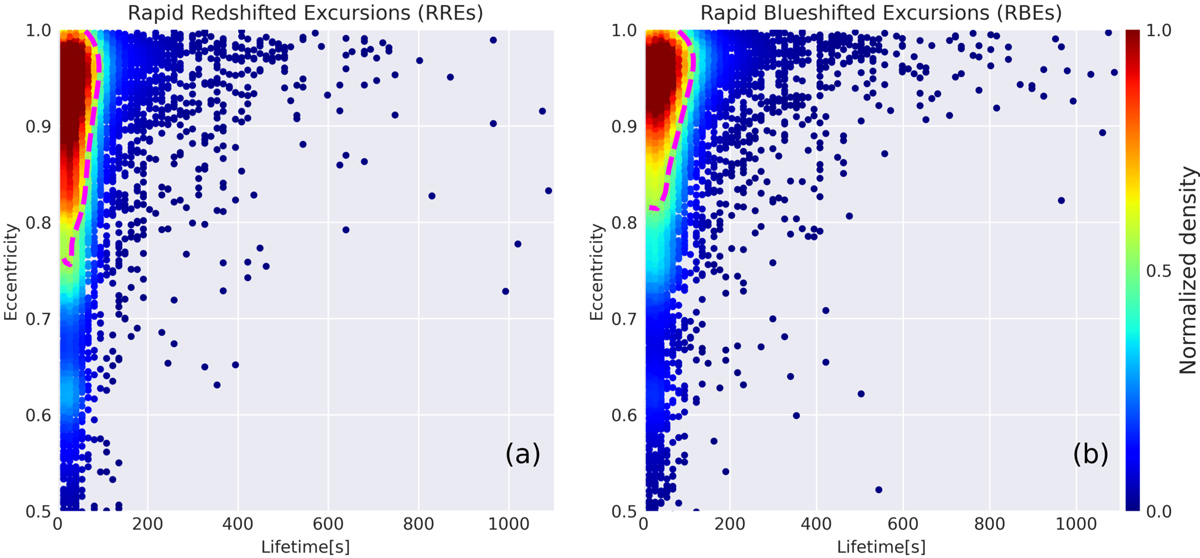
Bi-variate joint probability density between lifetime and eccentricity (of the fitted ellipses) of (a) RREs/downflowing RREs and (b) RBEs in rainbow colormap as in Fig. 11. The magenta contour indicates the region within which 70% of the events lie.
Current usage metrics show cumulative count of Article Views (full-text article views including HTML views, PDF and ePub downloads, according to the available data) and Abstracts Views on Vision4Press platform.
Data correspond to usage on the plateform after 2015. The current usage metrics is available 48-96 hours after online publication and is updated daily on week days.
Initial download of the metrics may take a while.