Free Access
Fig. B.2.
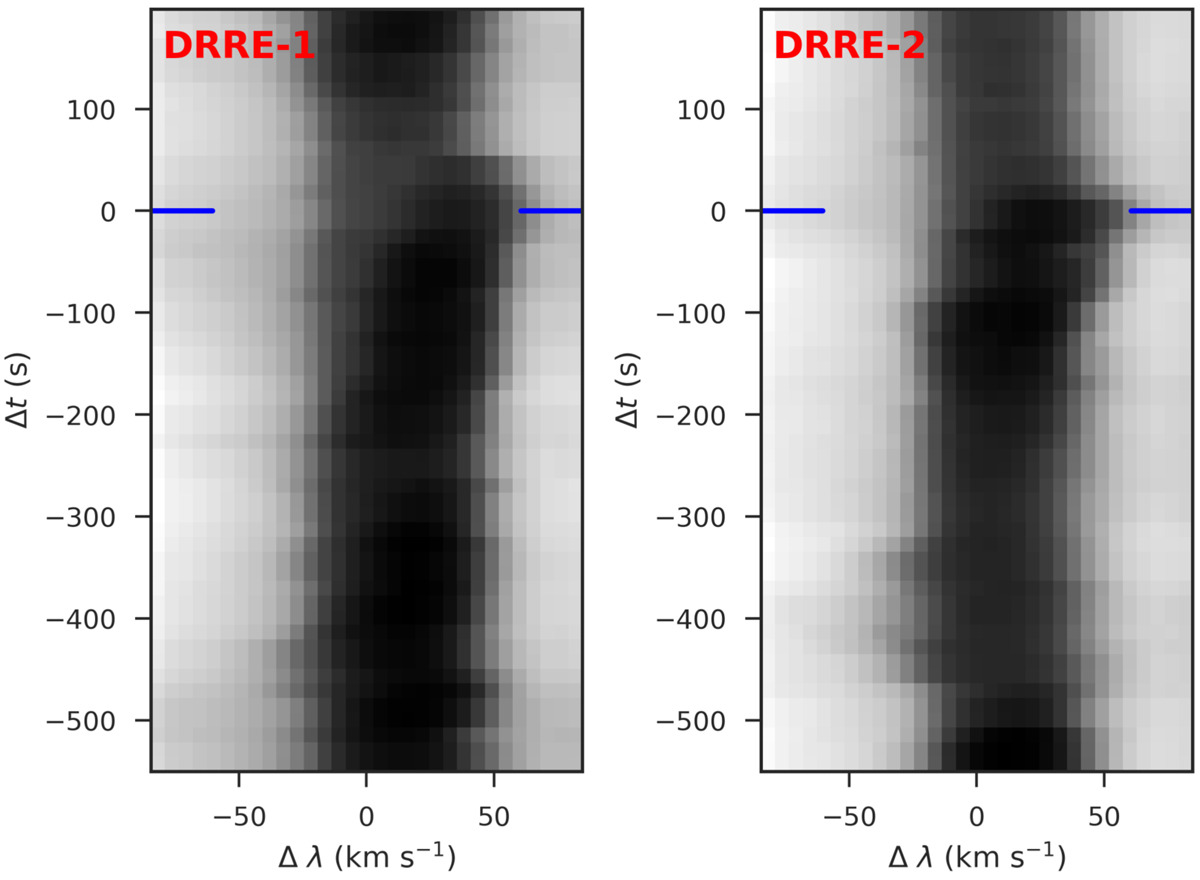
Extended λt diagrams corresponding to the two downflowing RREs shown in Fig. 7 displaying the lack of any blue shift preceding the downflowing RREs. The maximum excursion towards the red-wing of Hα is indicated by blue horizontal markers which also corresponds to the time shown in the λt diagram of Fig. 7.
Current usage metrics show cumulative count of Article Views (full-text article views including HTML views, PDF and ePub downloads, according to the available data) and Abstracts Views on Vision4Press platform.
Data correspond to usage on the plateform after 2015. The current usage metrics is available 48-96 hours after online publication and is updated daily on week days.
Initial download of the metrics may take a while.