Free Access
Fig. B.1.
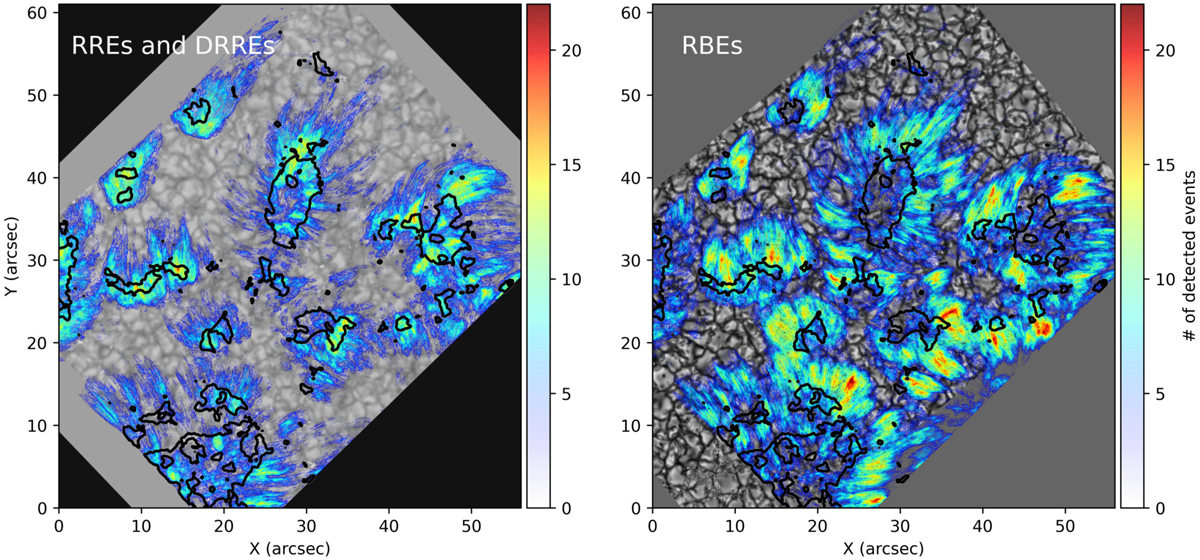
Overview of the location and density distribution of the total detected events over the whole FOV. Panel a: occurrence of RREs/downflowing RREs over the whole time series against an Hα red-wing image at 93 km s−1; panel b: occurrence of RBEs against a background of CHROMIS continuum image at 4000 Å.
Current usage metrics show cumulative count of Article Views (full-text article views including HTML views, PDF and ePub downloads, according to the available data) and Abstracts Views on Vision4Press platform.
Data correspond to usage on the plateform after 2015. The current usage metrics is available 48-96 hours after online publication and is updated daily on week days.
Initial download of the metrics may take a while.