Fig. 10.
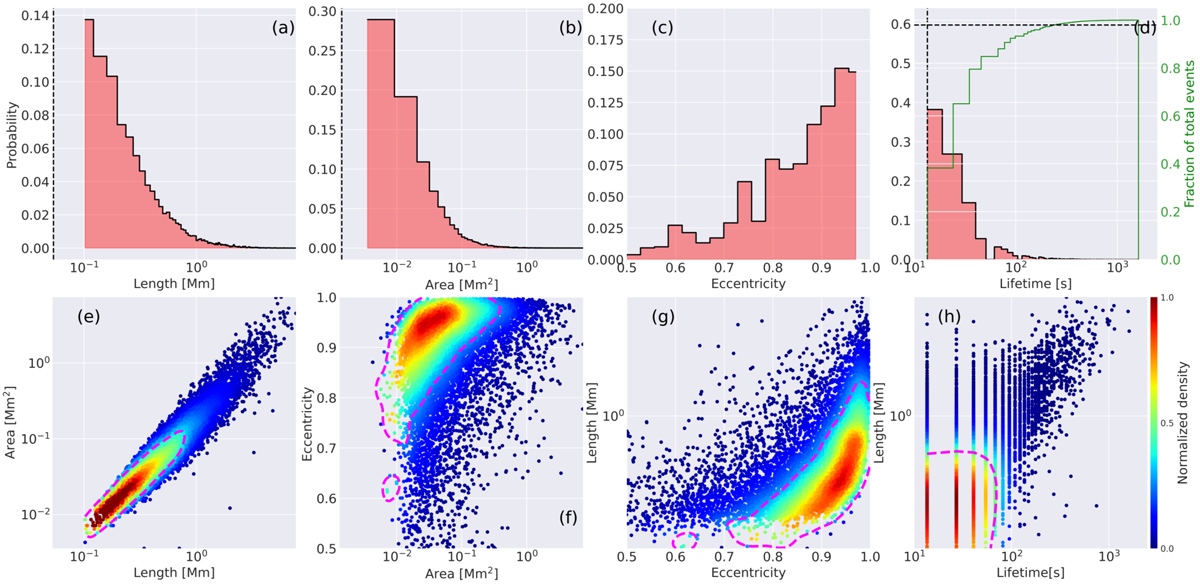
Dimensional analysis and lifetime statistics of RREs/downflowing RREs in our dataset. 1D histograms of length, area covered, eccentricity, and lifetime are shown in panels a, b, c and d respectively. Moreover, panel d also shows the ECDF of the lifetime distribution in solid green and the dashed black horizontal line indicates the 98% mark. The vertical dashed lines in panels a, b, and d indicates the spatial and temporal resolution limits of our data. Panels e–h: multivariate JPDFs between various quantities as indicated in a rainbow colormap with red (blue) indicating highest (lowest) density regions. The magenta contour overlaid on each of the density distribution indicates the region within which 70% of the events lie.
Current usage metrics show cumulative count of Article Views (full-text article views including HTML views, PDF and ePub downloads, according to the available data) and Abstracts Views on Vision4Press platform.
Data correspond to usage on the plateform after 2015. The current usage metrics is available 48-96 hours after online publication and is updated daily on week days.
Initial download of the metrics may take a while.