Fig. 1.
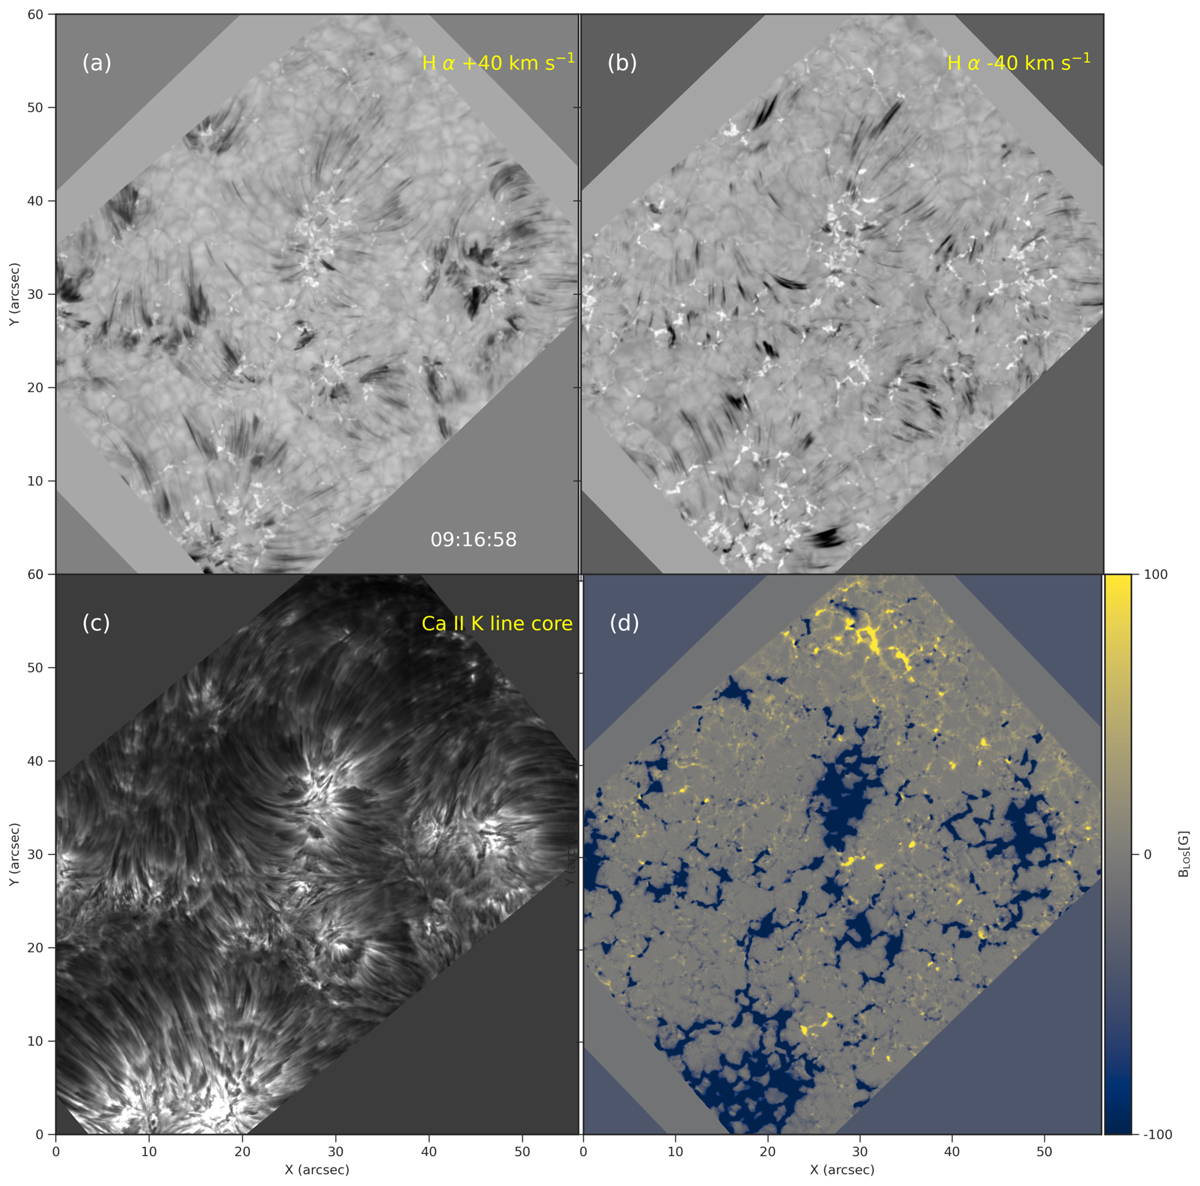
Full FOV of the SST dataset observed on 25 May 2017 at 09:16:58 UTC. Panels a and b: Hα red wing and blue wing images observed with CRISP at a Doppler offset of +40 km s−1 and −40 km s−1, respectively. Spicules are seen in the two panels as dark and elongated thread-like structures. Panel c: a dense chromospheric canopy of fibrils in the corresponding CHROMIS Ca II K line core image and panel d: map of the LOS magnetic field (BLOS) saturated between ±100 G derived from inversions of the Fe I 6301 and 6302 Å spectral profiles. The direction to solar north is pointing upward. An animation of this figure is available online.
Current usage metrics show cumulative count of Article Views (full-text article views including HTML views, PDF and ePub downloads, according to the available data) and Abstracts Views on Vision4Press platform.
Data correspond to usage on the plateform after 2015. The current usage metrics is available 48-96 hours after online publication and is updated daily on week days.
Initial download of the metrics may take a while.