Fig. 6.
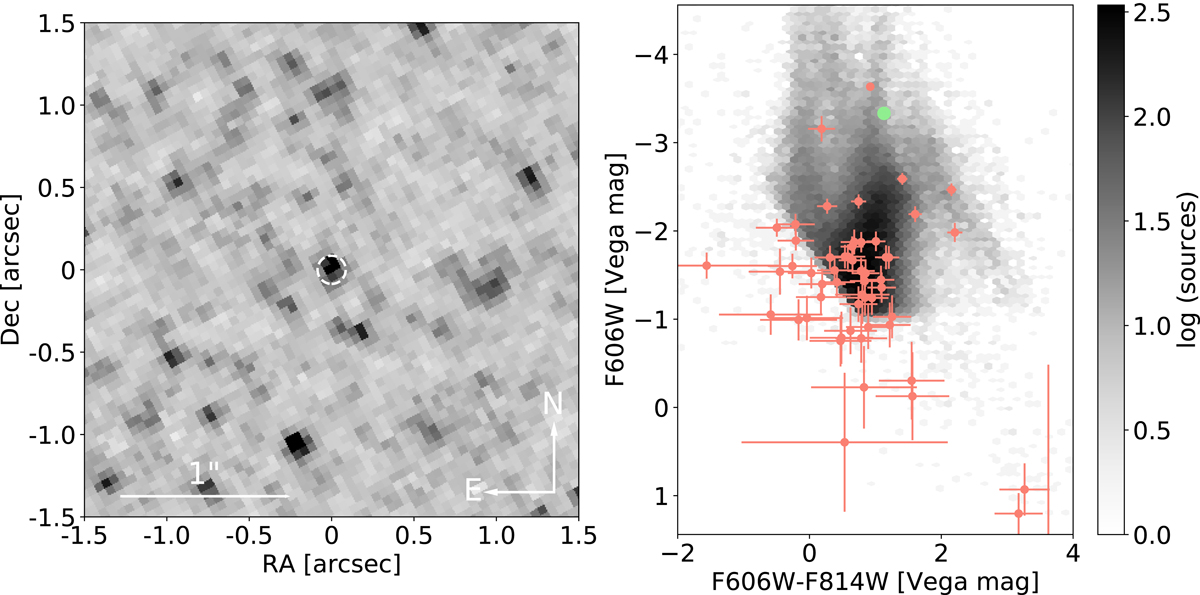
Left panel: location of AT 2020hat in the HST/ACS + F606W pre-discovery image. The dashed white circle is centred on the transformed position of the transient and has a radius of 3× our positional uncertainty. Right panel: grey density plot shows the colour-magnitude diagram for all sources detected in both F606W and F814W filters at a combined S/N > 5. A foreground reddening AV = 0.29 mag and distance modulus μ = 28.56 mag have been corrected for. The sharp diagonal detection cut is due to limiting magnitude, as determined by the S/N threshold. Pink points are sources within 1″ of AT 2020hat as indicated in the left panel, for which the S/N > 5 detection threshold has been relaxed (as a consequence, they are plotted with large error bars). The green point is the progenitor candidate for AT 2020hat.
Current usage metrics show cumulative count of Article Views (full-text article views including HTML views, PDF and ePub downloads, according to the available data) and Abstracts Views on Vision4Press platform.
Data correspond to usage on the plateform after 2015. The current usage metrics is available 48-96 hours after online publication and is updated daily on week days.
Initial download of the metrics may take a while.