Fig. 4.
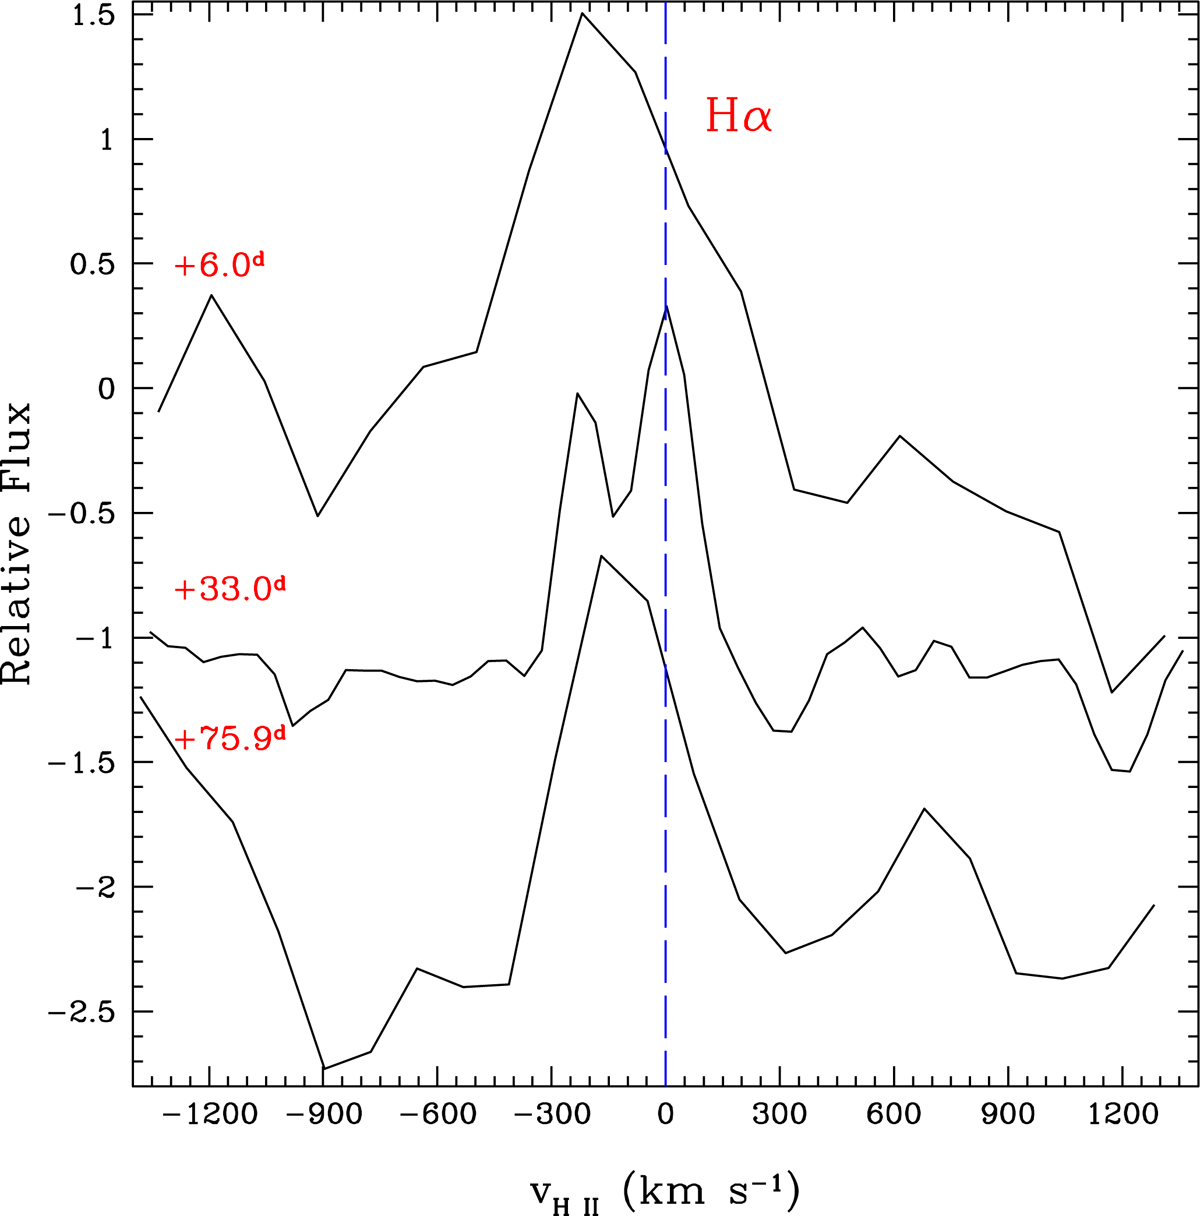
Blow-up of the Hα region in the mid-resolution OSIRIS spectrum of AT 2020hat at phase +33 d, compared with two low-resolution spectra taken at earlier (+6 d) and later (+75.9 d) phases. As no H II regions in the proximity of AT 2020hat have been spectroscopically observed in order to more accurately estimate the redshift at the LRN location, the spectra have been corrected for the average redshift of NGC 5068 (z = 0.002235).
Current usage metrics show cumulative count of Article Views (full-text article views including HTML views, PDF and ePub downloads, according to the available data) and Abstracts Views on Vision4Press platform.
Data correspond to usage on the plateform after 2015. The current usage metrics is available 48-96 hours after online publication and is updated daily on week days.
Initial download of the metrics may take a while.