Free Access
Fig. 3.
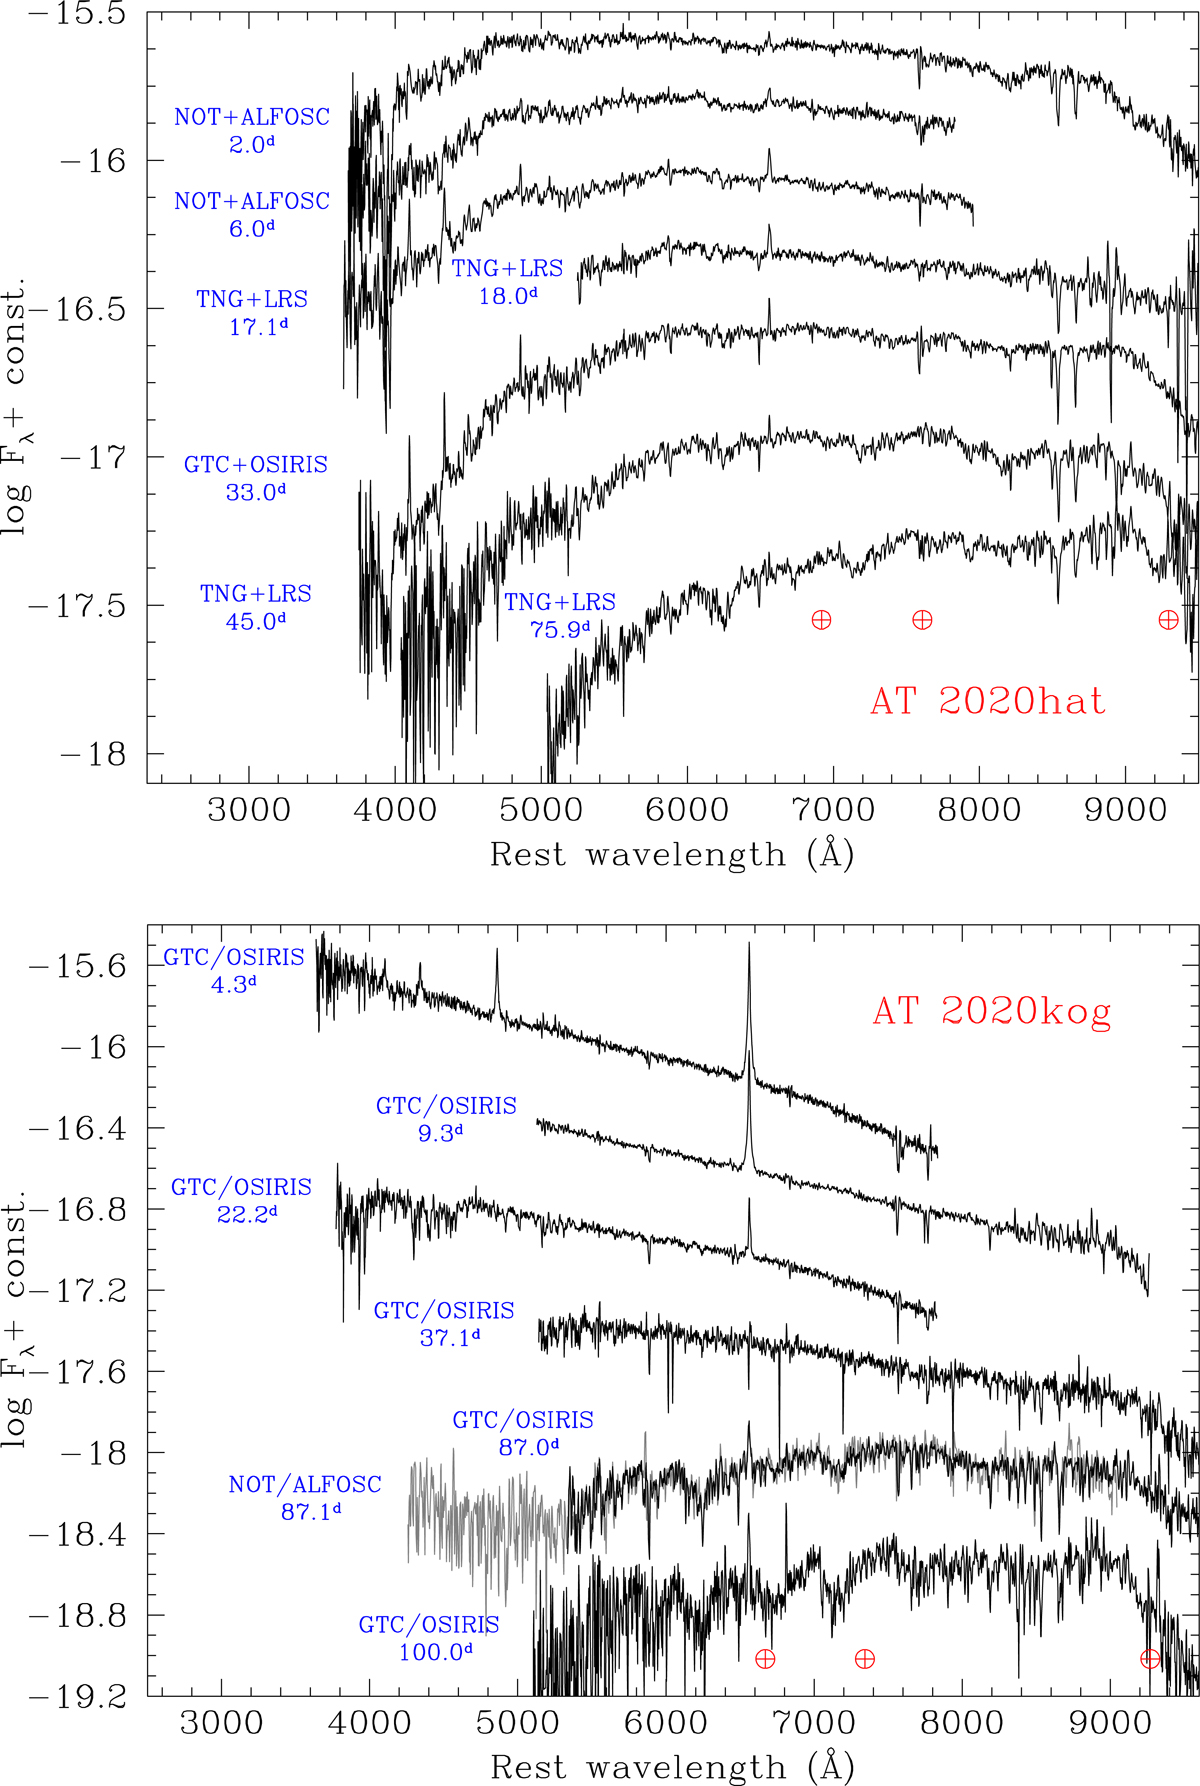
Spectroscopic evolution of AT 2020hat (top panel) and AT 2020kog (bottom panel). The spectra are redshift and reddening corrected. The phases reported on the left are with respect to the light curve maximum.
Current usage metrics show cumulative count of Article Views (full-text article views including HTML views, PDF and ePub downloads, according to the available data) and Abstracts Views on Vision4Press platform.
Data correspond to usage on the plateform after 2015. The current usage metrics is available 48-96 hours after online publication and is updated daily on week days.
Initial download of the metrics may take a while.