Fig. 2.
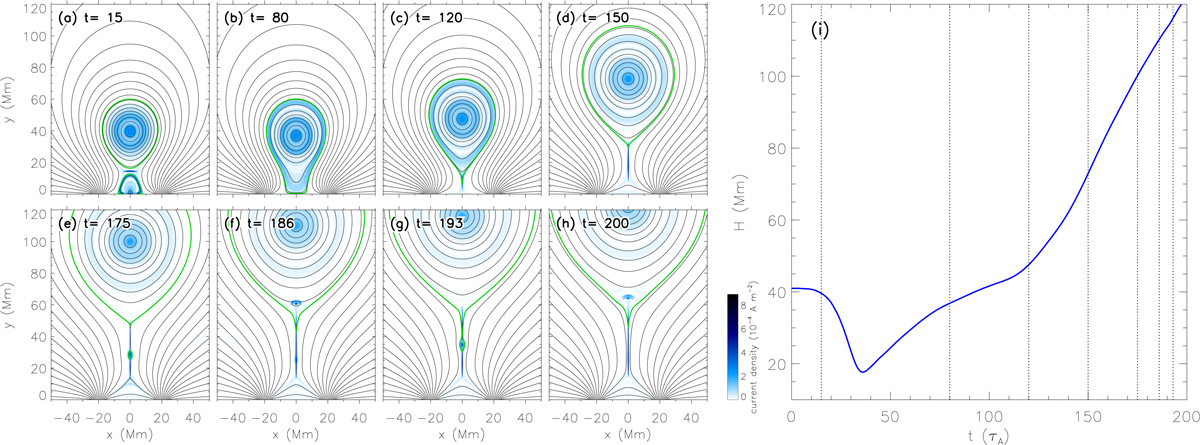
Eruptive process of the resultant flux rope after the flux feeding process with CE = 2.23. Panels a–h: illustrate the magnetic configurations at different times, and the blue color depicts the distribution of the current density. Panel i: evolution of the height of the rope axis, and the times of panels a–h are marked by the vertical dotted lines in panel i. The green curves in panels a–h mark the outer boundaries of the flux ropes and the plasmoids.
Current usage metrics show cumulative count of Article Views (full-text article views including HTML views, PDF and ePub downloads, according to the available data) and Abstracts Views on Vision4Press platform.
Data correspond to usage on the plateform after 2015. The current usage metrics is available 48-96 hours after online publication and is updated daily on week days.
Initial download of the metrics may take a while.