Fig. 1.
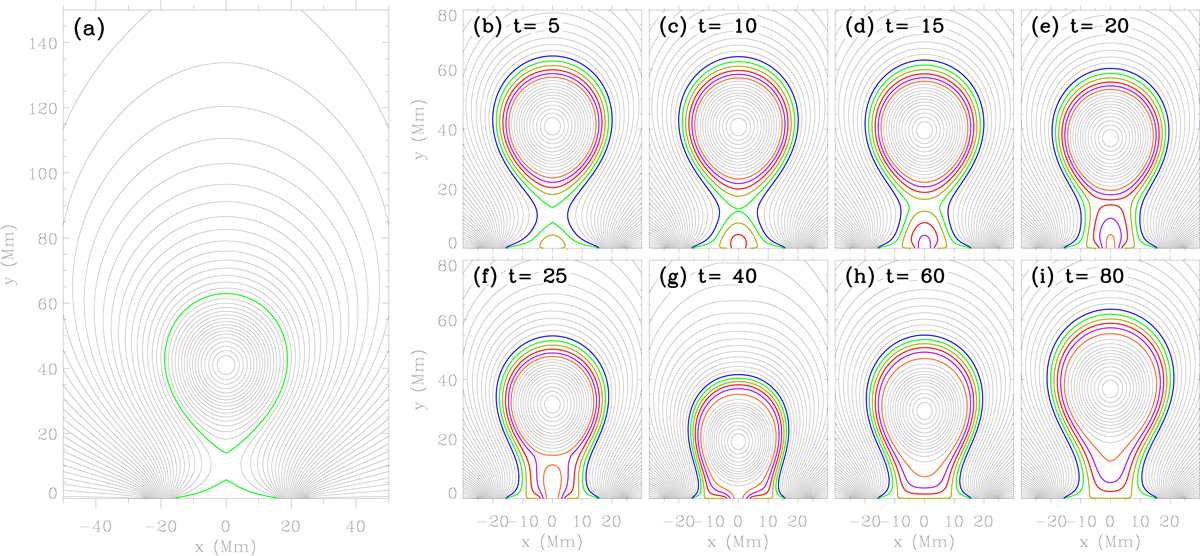
Evolution of the magnetic configuration during a flux feeding process with CE = 2.23. Panel a: initial flux-rope system with an HFT configuration; the green curves indicate the boundary of the major flux rope and that of the arcades below the rope. The times indicated in panels b–i are in units of τA. Different colors depict the magnetic field lines corresponding to different values of ψ.
Current usage metrics show cumulative count of Article Views (full-text article views including HTML views, PDF and ePub downloads, according to the available data) and Abstracts Views on Vision4Press platform.
Data correspond to usage on the plateform after 2015. The current usage metrics is available 48-96 hours after online publication and is updated daily on week days.
Initial download of the metrics may take a while.