Fig. 5
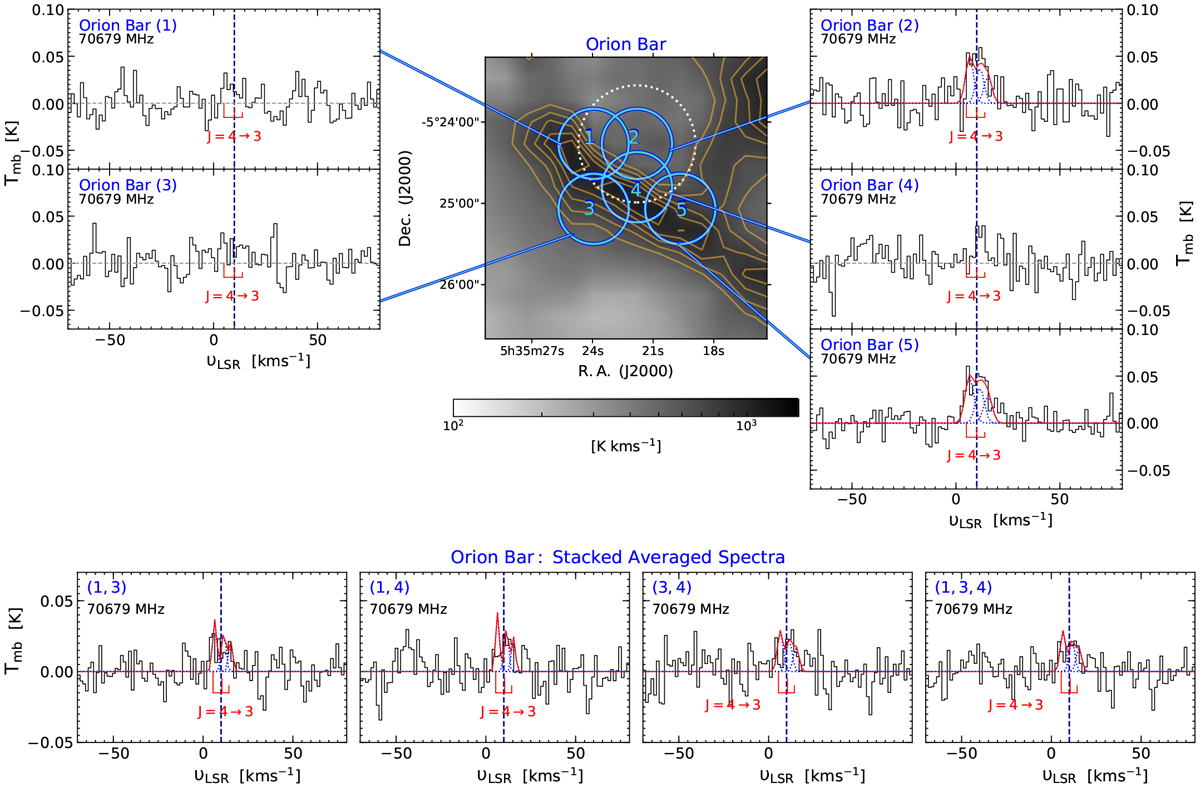
Top: same as Fig. 3 but for o-CH2 observations made using the Onsala 20 m telescope toward the Orion Bar region. The blue circles represent the beam size of the Onsala 20 m telescope centred at the different pointing positions and the dotted white circle marks the KP beam at the Orion Bar position marked in Fig. 2. Bottom: stacked and averaged o-CH2 spectra obtained by combining the Orion KL/S pointing positions (1), (3), and (4), two at a time and all together. The line fits are scaled using the line parameters obtained toward Orion Bar positions (2) and (5).
Current usage metrics show cumulative count of Article Views (full-text article views including HTML views, PDF and ePub downloads, according to the available data) and Abstracts Views on Vision4Press platform.
Data correspond to usage on the plateform after 2015. The current usage metrics is available 48-96 hours after online publication and is updated daily on week days.
Initial download of the metrics may take a while.