Fig. 9
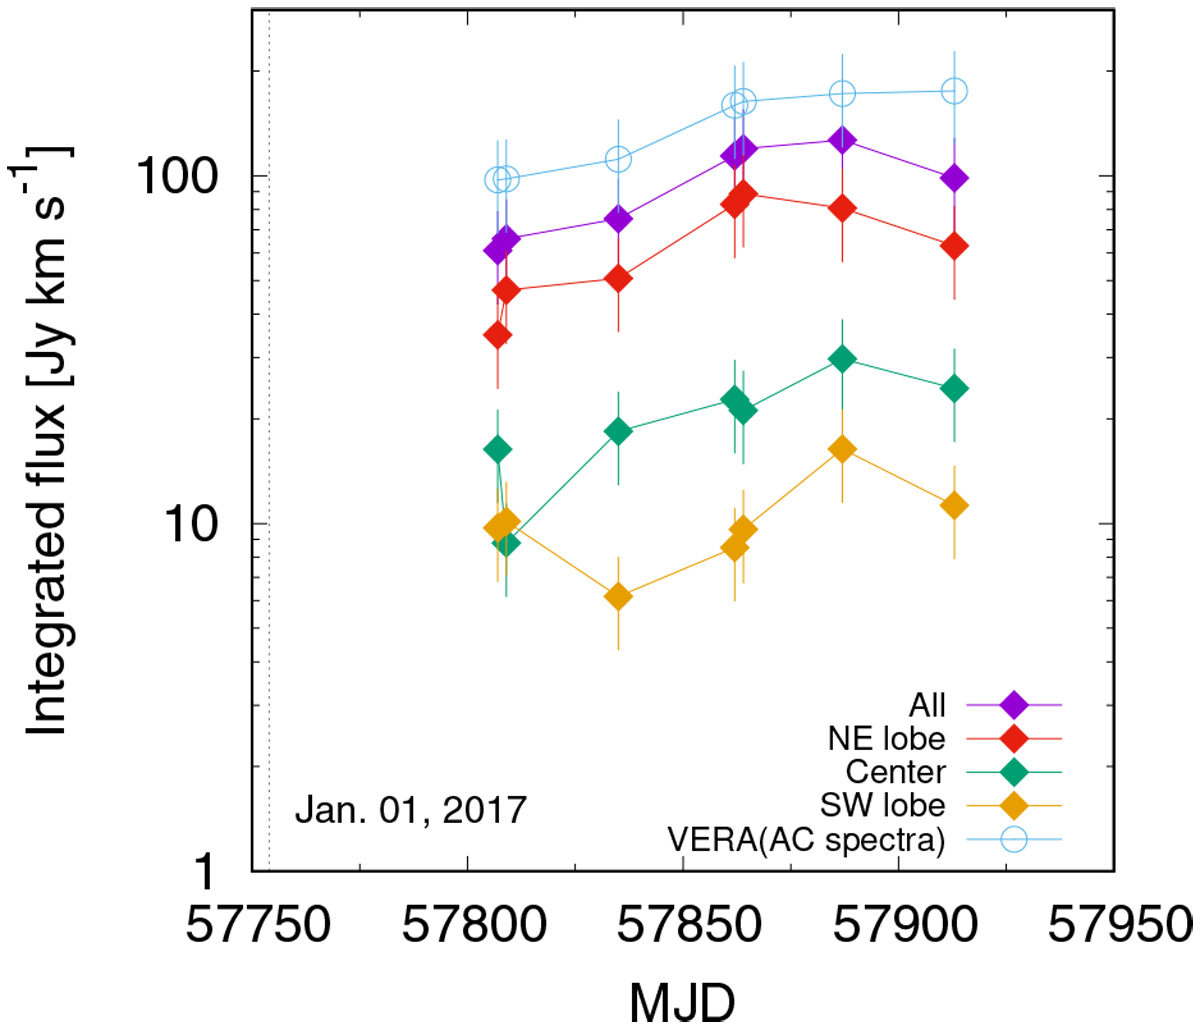
Flux densities of the H2O maser features in the whole region around NIRS 3, the NE lobe, central (continuum) position, and the SW lobe observed with VERA (the corresponding spectra are shown in Fig. 10). The flux densities were computed by integrating the emission over the velocity range between − 15 and + 25 km s−1. The error bars represent the 30% flux uncertainty. A dashed vertical line indicates January 01, 2017.
Current usage metrics show cumulative count of Article Views (full-text article views including HTML views, PDF and ePub downloads, according to the available data) and Abstracts Views on Vision4Press platform.
Data correspond to usage on the plateform after 2015. The current usage metrics is available 48-96 hours after online publication and is updated daily on week days.
Initial download of the metrics may take a while.