Fig. 8
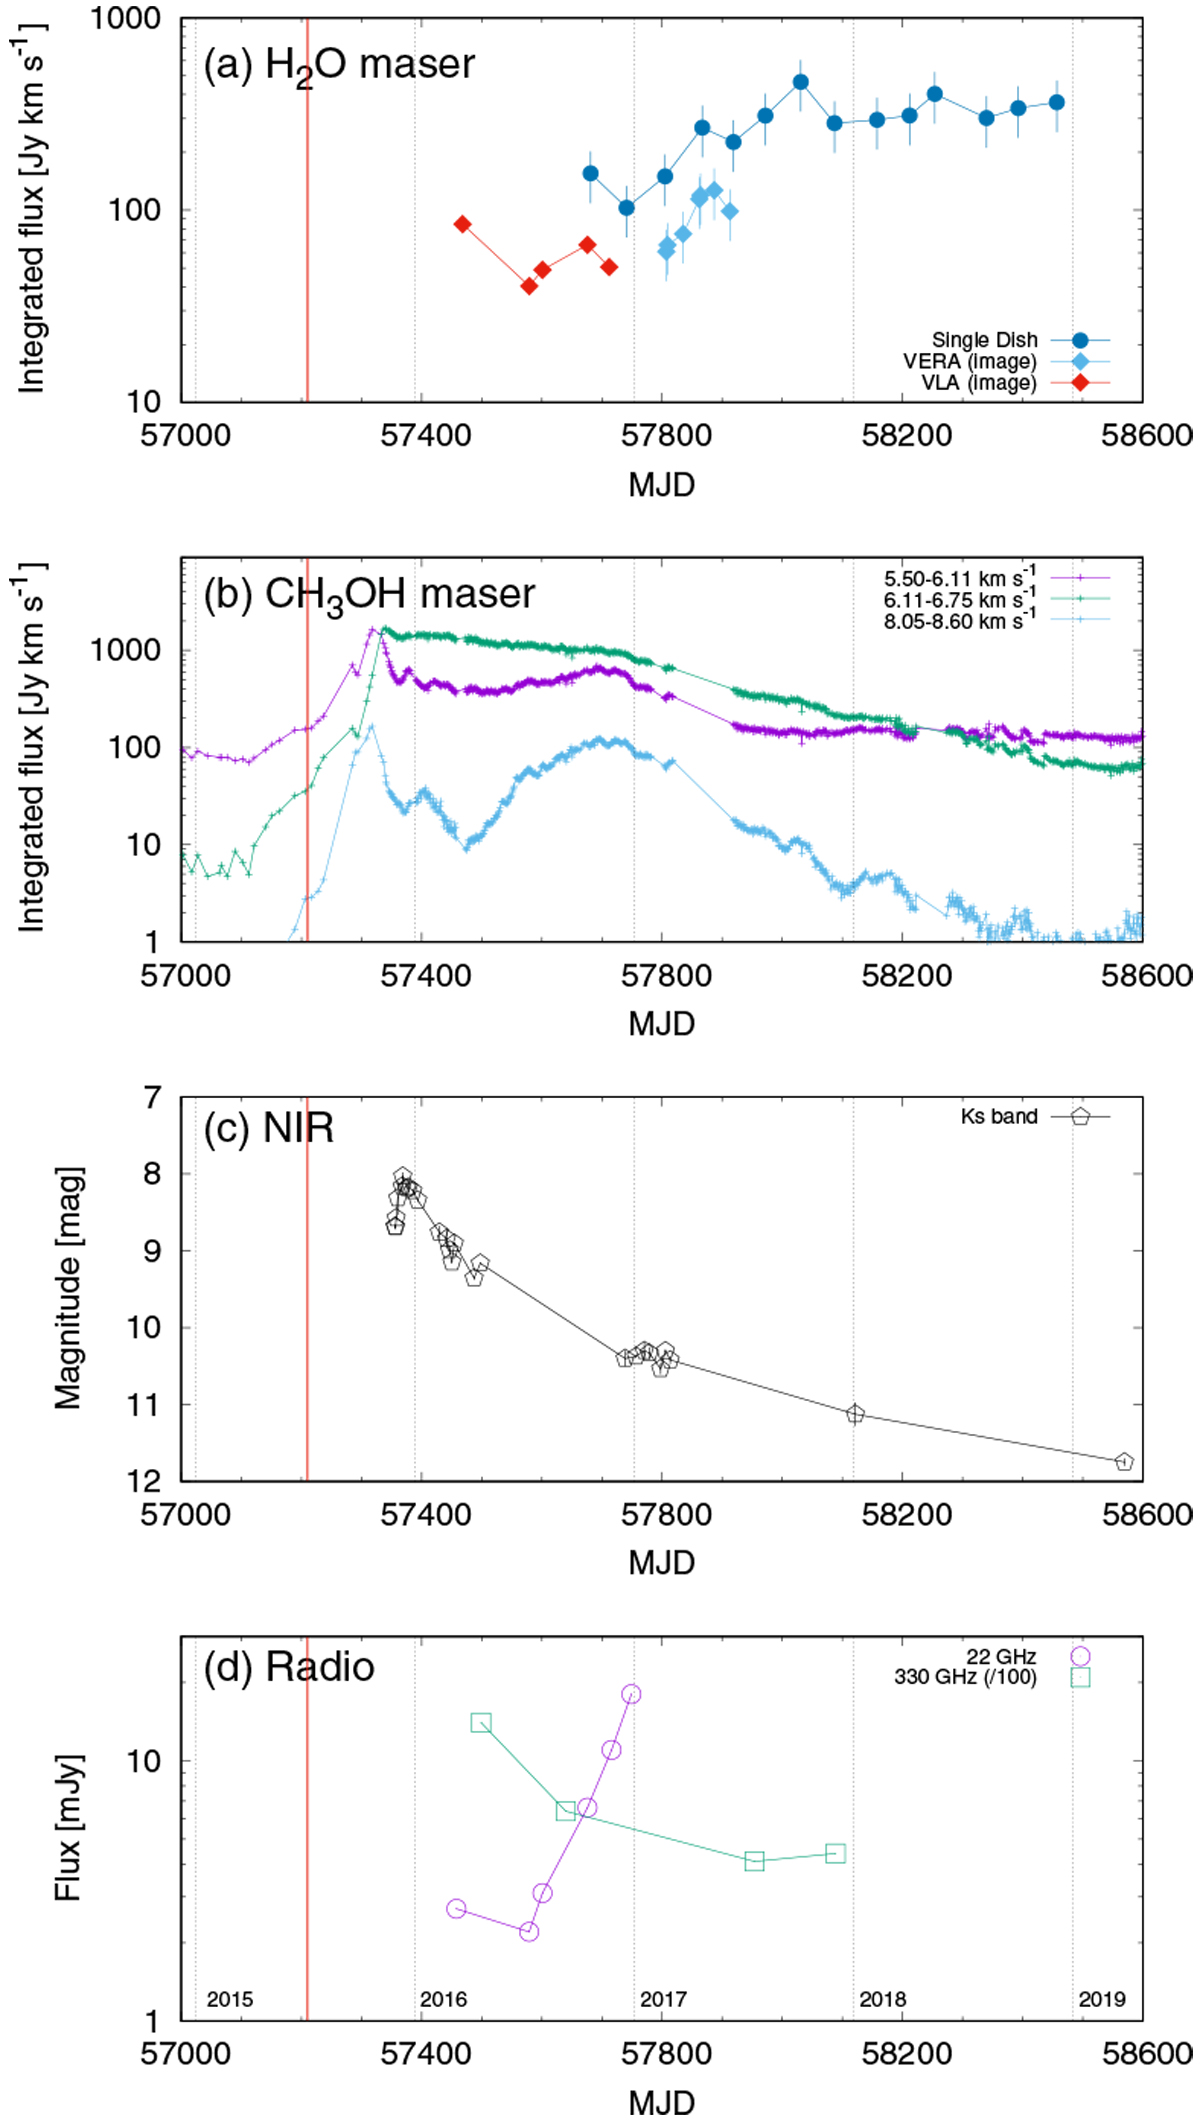
Light curves of maser lines and continuum emissions. A red vertical line indicates the start of the 6.7 GHz methanol maser flare (July 07, 2015) reported by Fujisawa et al. (2015). Dashed lines indicate the dates of January 01, from 2015 to 2019. (a) Flux densities of the H2O masers integrated between − 15 and + 25 km s−1, from the VLA and VERA observations. The VERA results include the single-dish monitoring and the integrated spectra extracted from the VLBI image cubes. The VLA data were extracted from the image cubes, excluding the NW component. (b) Flux densities of representative 6.7 GHz methanol maser features observed with the Hitachi 32-m radio telescope (Yonekura et al. 2016), showing different behaviors among the light curves. (c) IR light curve at Ks band observed with the 1.5-m Kanata telescope in Hiroshima, Japan (Uchiyama et al. 2020). (d) Variation of the radio continuum emission at 22 GHz observed with the VLA (Cesaroni et al. 2018) and ALMA Band 7 at ~330 GHz (Liu et al. 2018, present paper). For the 330 GHz continuum emission on December 02, 2017 measured in the present study, we used the value obtained by integrating over a 0.5′′ aperture (420 mJy) rather than the result of the Gaussian fit (see discussion in Sect. 3.3).
Current usage metrics show cumulative count of Article Views (full-text article views including HTML views, PDF and ePub downloads, according to the available data) and Abstracts Views on Vision4Press platform.
Data correspond to usage on the plateform after 2015. The current usage metrics is available 48-96 hours after online publication and is updated daily on week days.
Initial download of the metrics may take a while.