Fig. 7
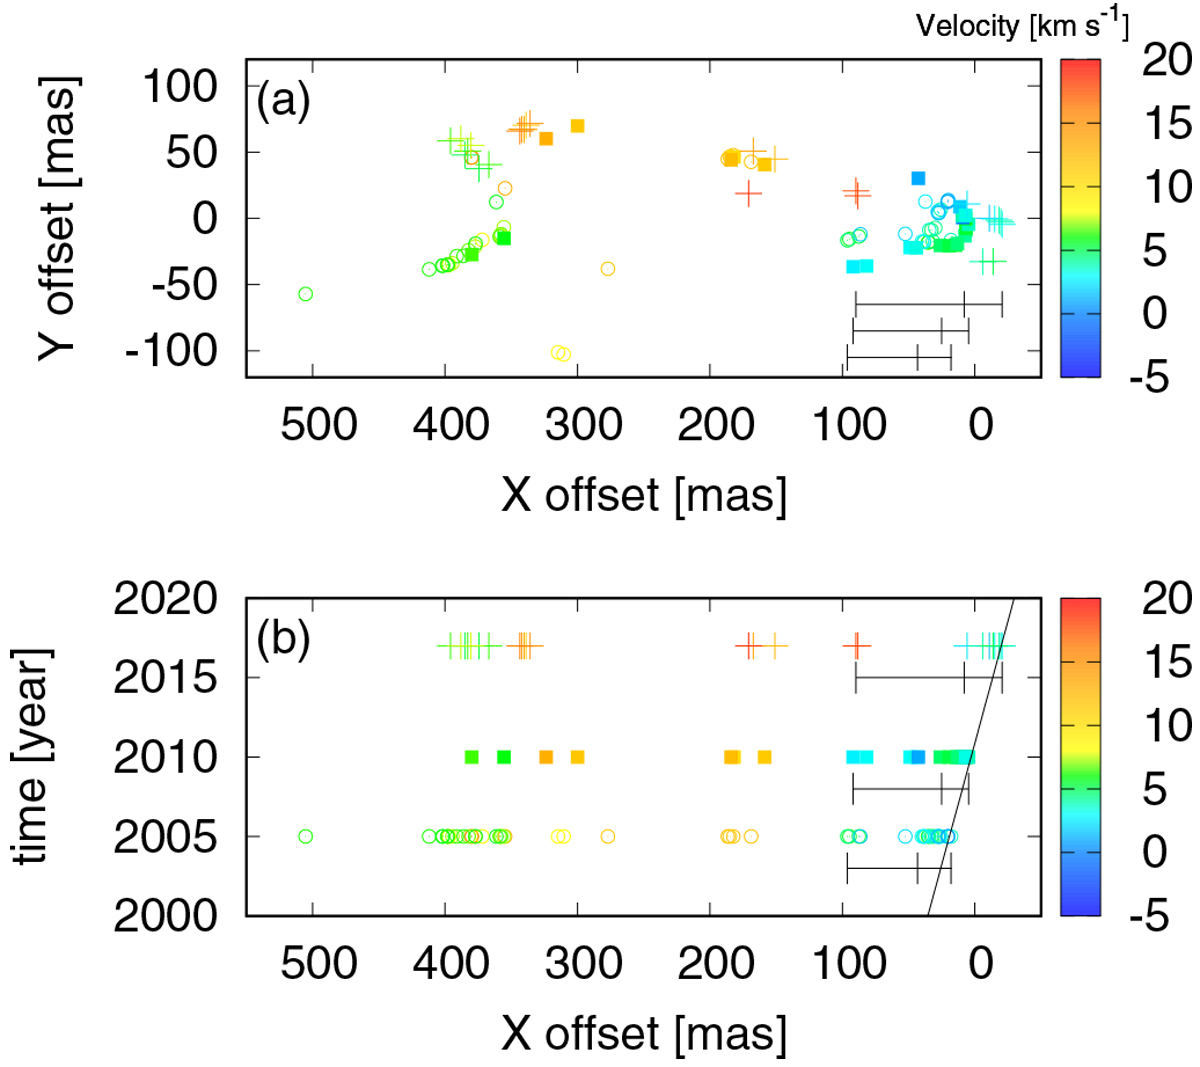
(a) Distributions of the 22 GHz H2O maser features obtained after rotating the plot in Fig. 5 by 43.5 degrees. The abscissa is parallel to the outflow as indicated by a solid line in Fig. 5. Horizontal bars at the bottom right corner indicate the minimum, maximum, and mean positions of the SW lobealong the outflow axis for each epoch (2005, 2010, and 2017 from bottom to top). (b) Same as (a), where the displacement along the Y axis has been replaced by the observing epoch. The black solid line represents the movement of the head of the bow shock along the outflow axis.
Current usage metrics show cumulative count of Article Views (full-text article views including HTML views, PDF and ePub downloads, according to the available data) and Abstracts Views on Vision4Press platform.
Data correspond to usage on the plateform after 2015. The current usage metrics is available 48-96 hours after online publication and is updated daily on week days.
Initial download of the metrics may take a while.