Fig. 5
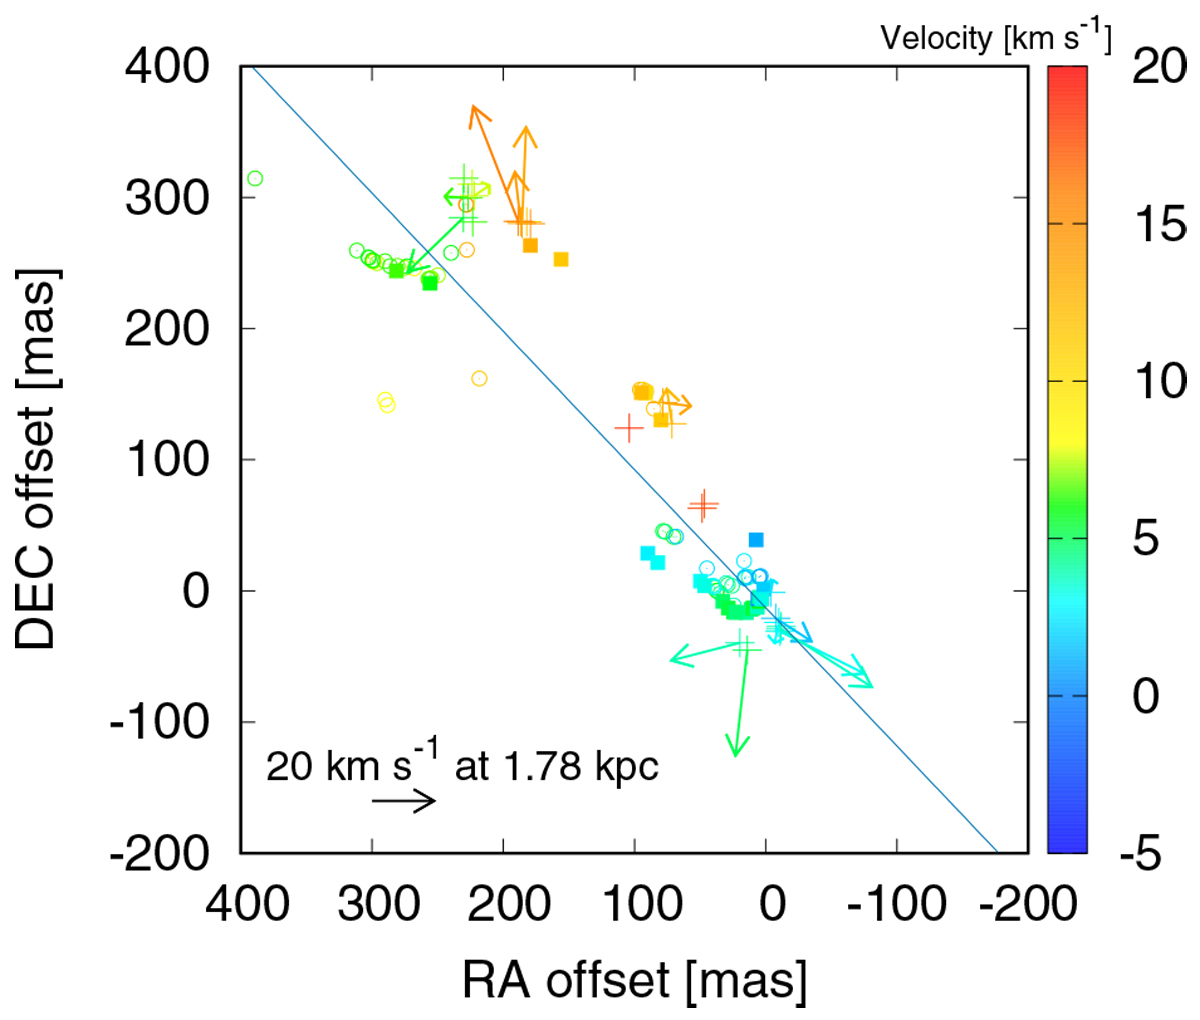
Distributions of the 22 GHz H2O masers indicated by the plus symbols with the proper motion vectors measured with respect to the barycenter. The color code indicates the LSR velocities of the maser features. The 22 GHz H2O maser features observed in previous observations by Goddi et al. (2007) in 2005 and Burns et al. (2016) in 2010 are also plottedwith open circles and filled squares, respectively. The solid line indicates the outflow axis derived from a linear fit to the positions of all maser features, including previous results.
Current usage metrics show cumulative count of Article Views (full-text article views including HTML views, PDF and ePub downloads, according to the available data) and Abstracts Views on Vision4Press platform.
Data correspond to usage on the plateform after 2015. The current usage metrics is available 48-96 hours after online publication and is updated daily on week days.
Initial download of the metrics may take a while.