Fig. 4
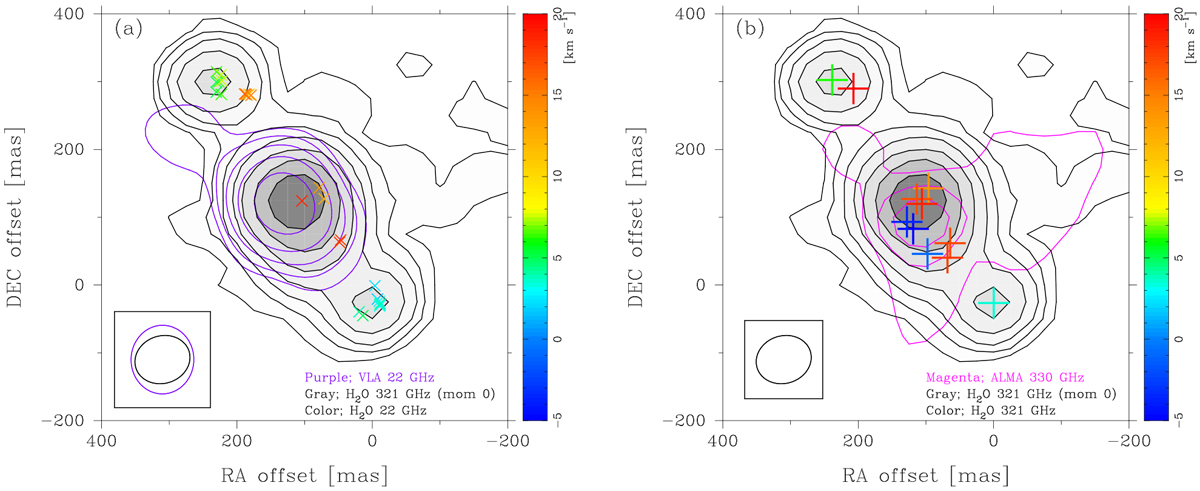
(a) Distribution of the 22 GHz H2O maser features (colored symbols; Table 2) superposed on the VLA K-band continuum observed on December 27, 2016 (purple contours; Cesaroni et al. 2018) and the moment 0 map of the 321 GHz H2O maser emission (gray scale). Contour levels are 4, 8, 16, ... times the rms noise level of the 0.13 mJy beam−1 and the 32 mJy beam−1 km s−1 for the VLA K-band continuum and the moment 0 map of the 321 GHz H2O, respectively. The (0, 0) position is the phase tracking center, RA(J2000) = 06h12m54.006s and Dec = +17°59′22.96′′. The synthesized beam size of the ALMA Band 7 observation is shown in the bottom left corner of each panel. (b) Distribution of peak centroids of the 321 GHz H2O maser features (colored symbols) superposed on the ALMA Band 7 continuum (magenta contours) and the moment 0 map of the 321 GHz H2O maser emission (gray scale). Contour levels for the ALMA Band 7 continuum are 32, 64, and 128 times the rms noise level of 0.33 mJy beam−1, showing only the brightest part around the continuum peak.
Current usage metrics show cumulative count of Article Views (full-text article views including HTML views, PDF and ePub downloads, according to the available data) and Abstracts Views on Vision4Press platform.
Data correspond to usage on the plateform after 2015. The current usage metrics is available 48-96 hours after online publication and is updated daily on week days.
Initial download of the metrics may take a while.