Fig. 3
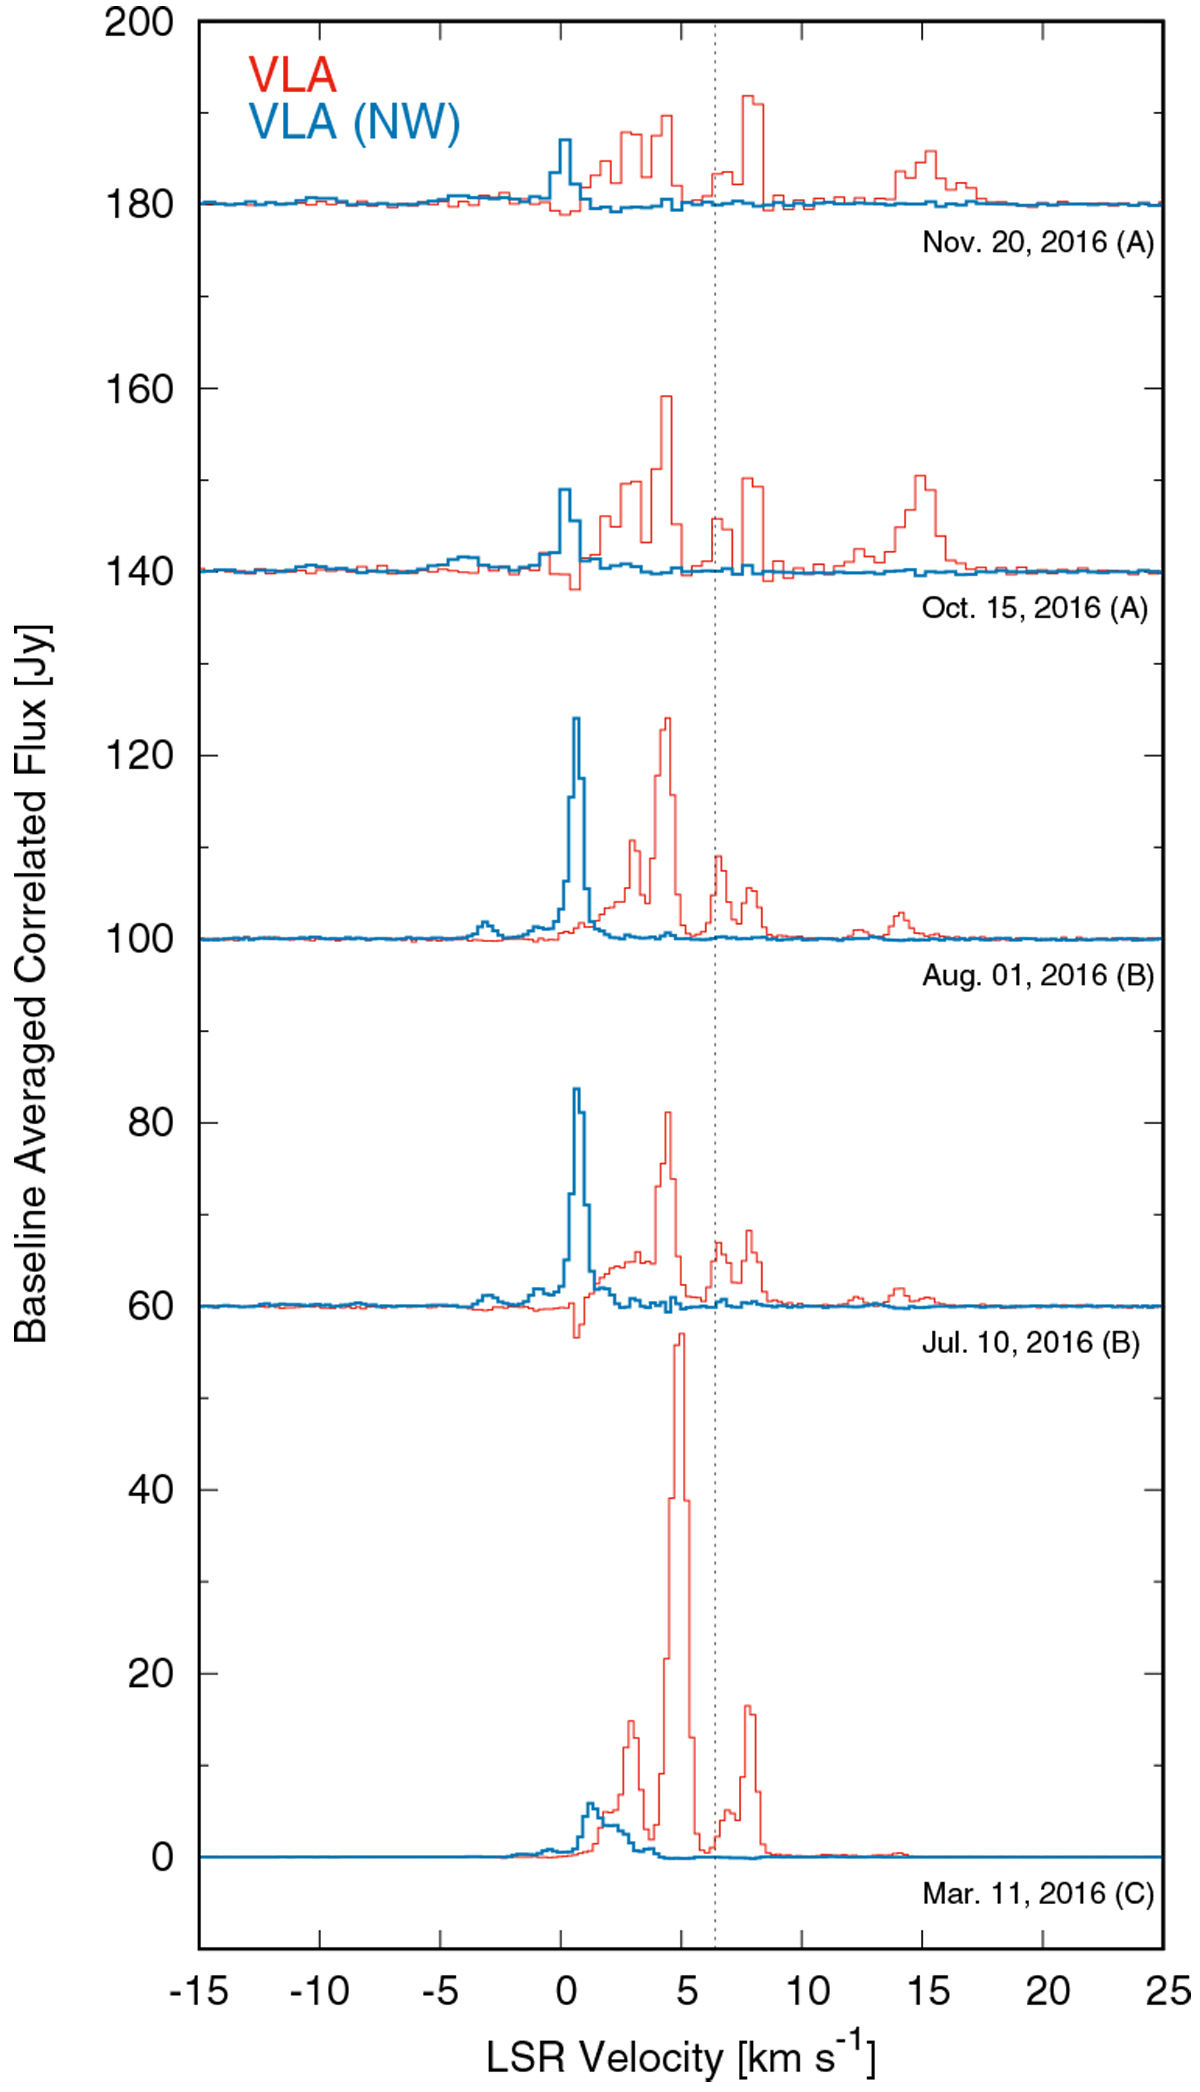
Velocity-integrated flux densities of the 22 GHz H2O masers observed with the VLA. A vertical dashed line indicates the LSR velocity of 6.4 km s−1, corresponding to the brightest components during the VERA monitoring (Fig. 2). The red and blue lines correspond to the spectrum integrated around the central source NIRS 3 and that of the newly found feature offset by 5′′ northwest (NW) of NIRS 3, respectively.
Current usage metrics show cumulative count of Article Views (full-text article views including HTML views, PDF and ePub downloads, according to the available data) and Abstracts Views on Vision4Press platform.
Data correspond to usage on the plateform after 2015. The current usage metrics is available 48-96 hours after online publication and is updated daily on week days.
Initial download of the metrics may take a while.