Fig. 2
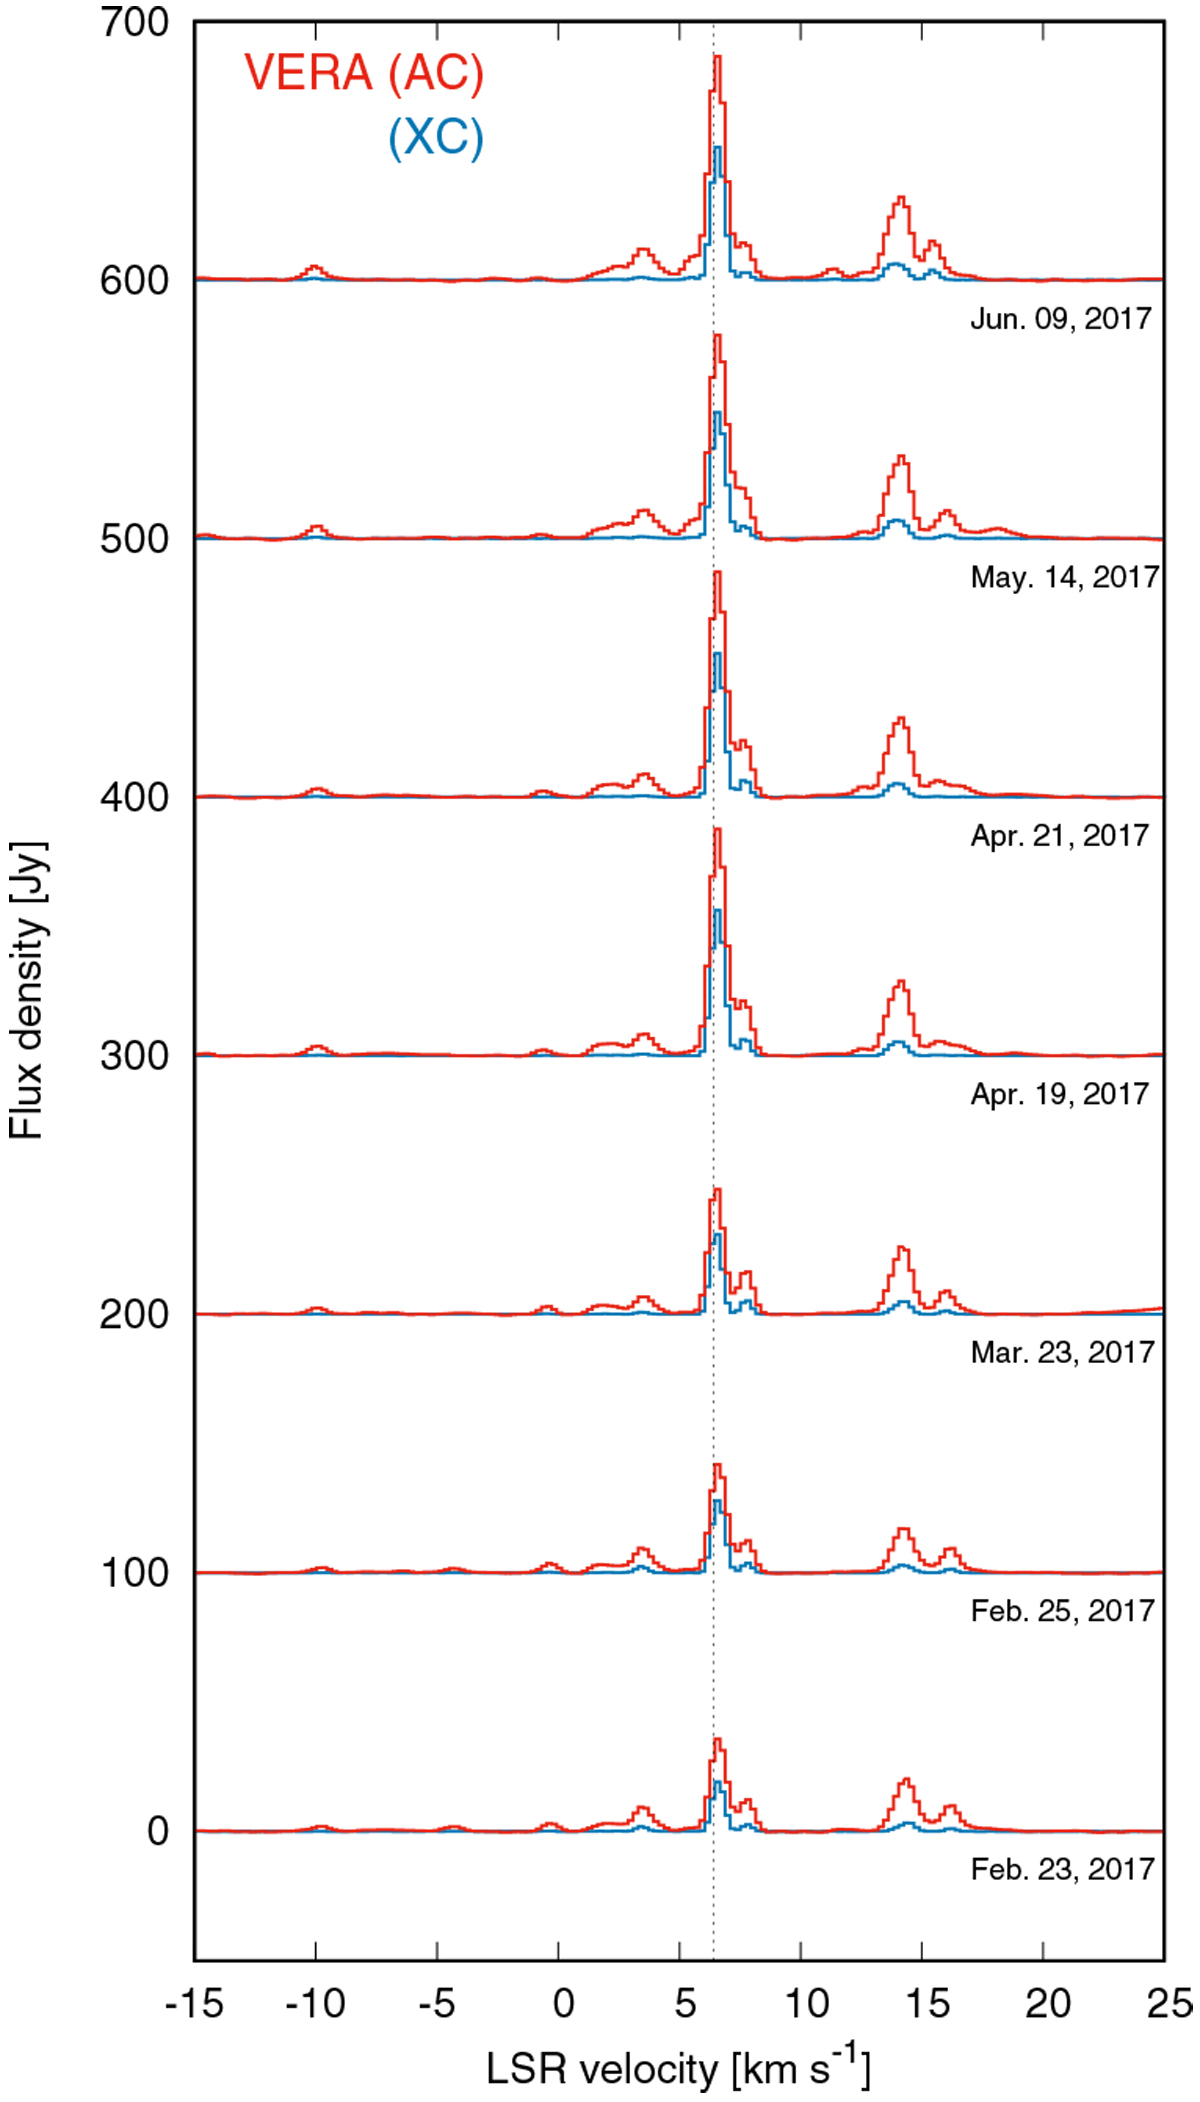
Auto-correlation total-power (solid red lines, AC) and scalar-averaged cross-power (blue solid lines, XC) spectra of the H2O masers. Thespectra were computed by averaging all the antennas/baselines and time ranges. Baselines were subtracted by fitting the line-free channels with a polynomial function. A vertical dashed line indicates the LSR velocity of 6.4 km s−1, corresponding to the brightest components.
Current usage metrics show cumulative count of Article Views (full-text article views including HTML views, PDF and ePub downloads, according to the available data) and Abstracts Views on Vision4Press platform.
Data correspond to usage on the plateform after 2015. The current usage metrics is available 48-96 hours after online publication and is updated daily on week days.
Initial download of the metrics may take a while.