Free Access
Fig. 4.
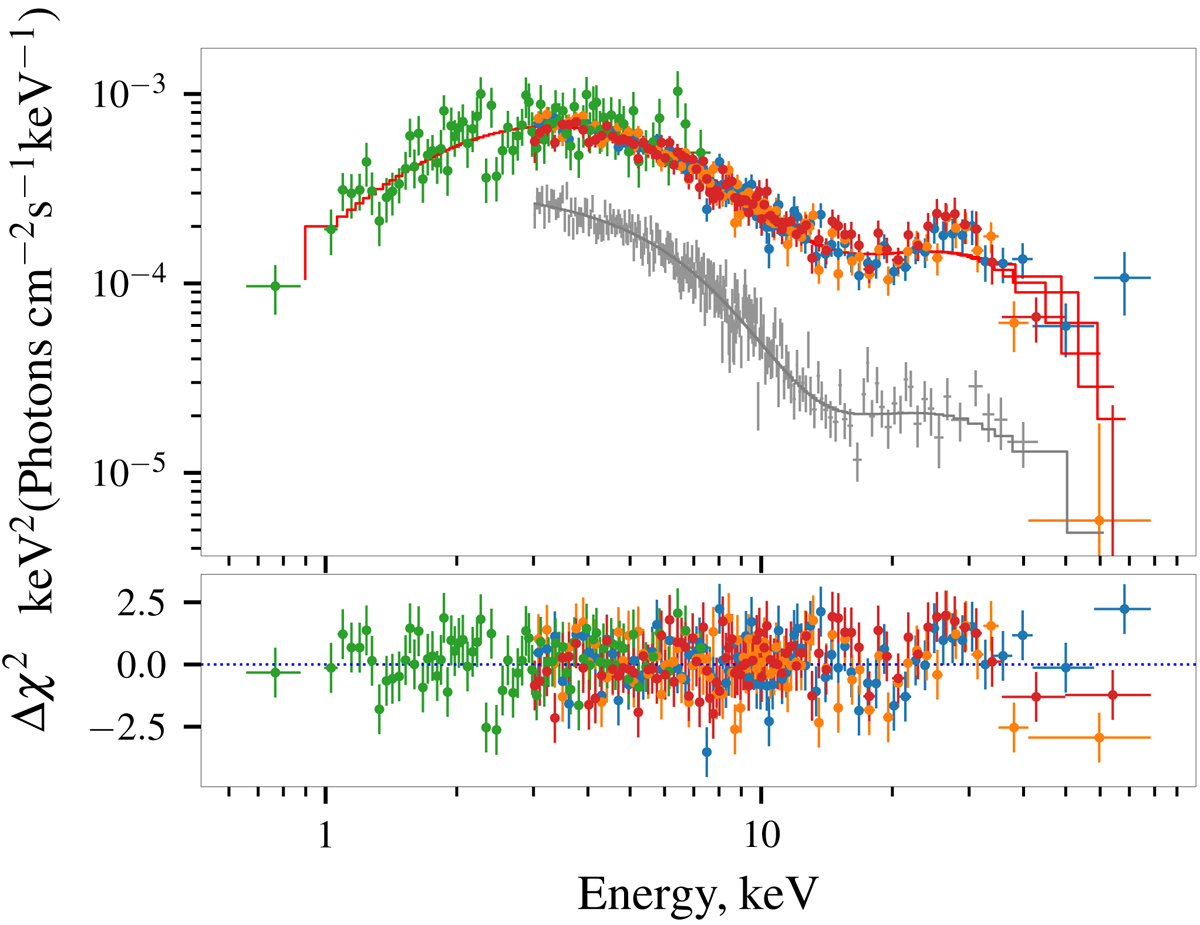
Unfolded spectrum of 2SXPS J075542.5−293353 at high flux level (spectral group A) as observed by Chandra (green) and NuSTAR (other colors) together with the residuals to the best-fit model. For comparison, the spectrum of GX 304−1 as reported in Tsygankov et al. (2019b) is also shown (in gray; arbitrarily scaled).
Current usage metrics show cumulative count of Article Views (full-text article views including HTML views, PDF and ePub downloads, according to the available data) and Abstracts Views on Vision4Press platform.
Data correspond to usage on the plateform after 2015. The current usage metrics is available 48-96 hours after online publication and is updated daily on week days.
Initial download of the metrics may take a while.