Fig. 5.
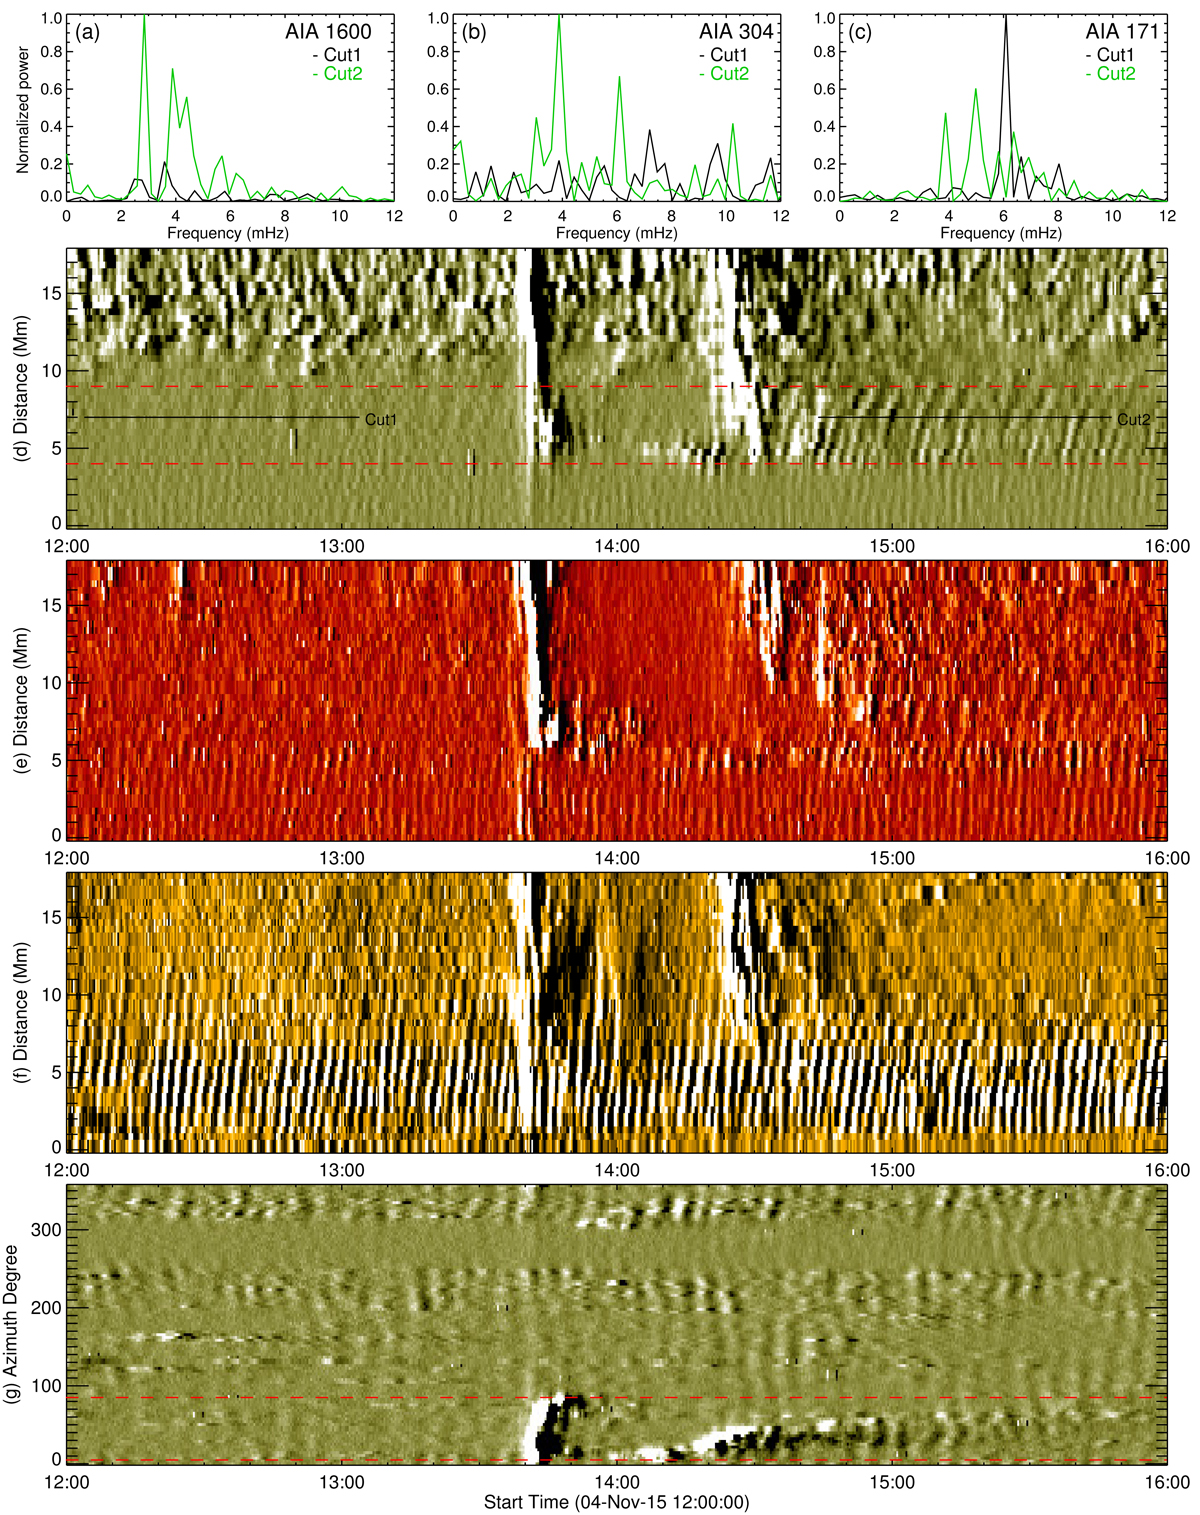
RPWs observed across the MFR eruption. Panels a–c: power spectra of time series along Cut1 (black) and Cut2 (green) in the time-distance maps in panels d–f, which are constructed by applying the linear slit (Fig. 2d) to 1600, 304, and 171 Å images, respectively. The time-distance map in panel g is made by applying the circular slit (Fig. 4b) to 1600 Å images. The PROI is bounded by two red dashed lines in panels d and g.
Current usage metrics show cumulative count of Article Views (full-text article views including HTML views, PDF and ePub downloads, according to the available data) and Abstracts Views on Vision4Press platform.
Data correspond to usage on the plateform after 2015. The current usage metrics is available 48-96 hours after online publication and is updated daily on week days.
Initial download of the metrics may take a while.