Fig. 3.
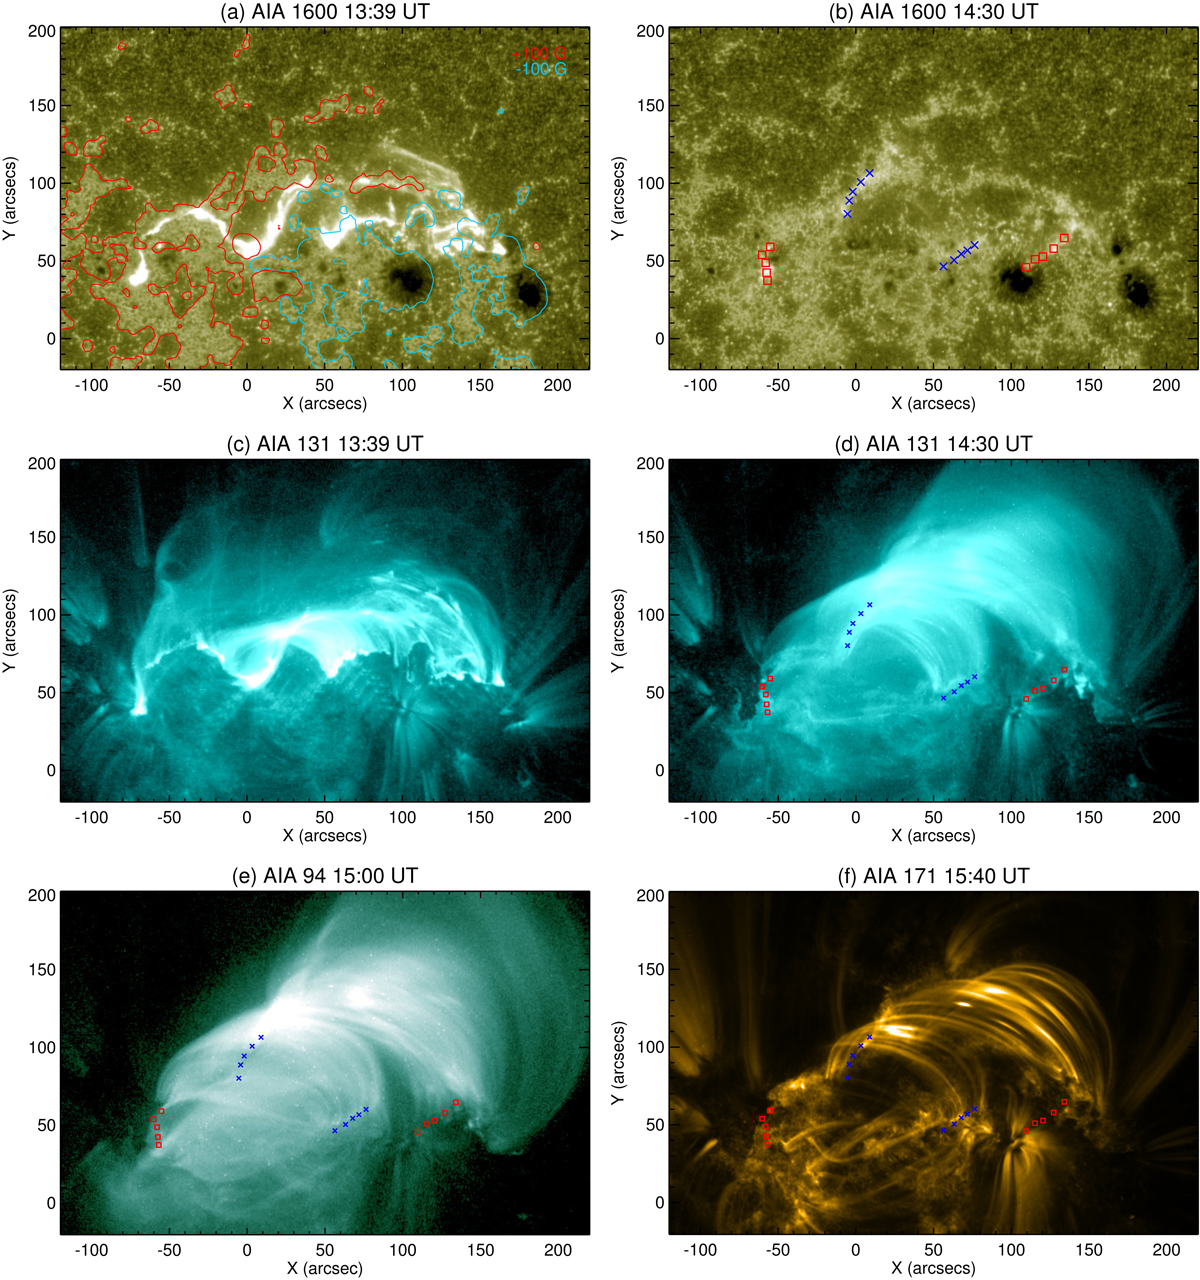
Connectivity of flare loops. Panels a, b: flare ribbons in 1600 Å during the rope-buildup and rope-erosion stage, respectively. Panel a is superimposed by contours of a line-of-sight magnetogram at the levels of ±100 G in red (positive polarity) and cyan (negative polarity). In panel b straight ribbons are marked by blue crosses and hooked ribbons by red squares. These symbols are replotted in panels d–f. Panel c: 131 Å image taken at the same time as panel a. Panels d–f: AIA 131, 94, and 171 Å image, respectively, taken at successively later times. Post-flare loops of cooler temperatures dominate at later times, but their connectivities with respect to the hooked and straight flare ribbons are consistent with each other.
Current usage metrics show cumulative count of Article Views (full-text article views including HTML views, PDF and ePub downloads, according to the available data) and Abstracts Views on Vision4Press platform.
Data correspond to usage on the plateform after 2015. The current usage metrics is available 48-96 hours after online publication and is updated daily on week days.
Initial download of the metrics may take a while.