Fig. 2.
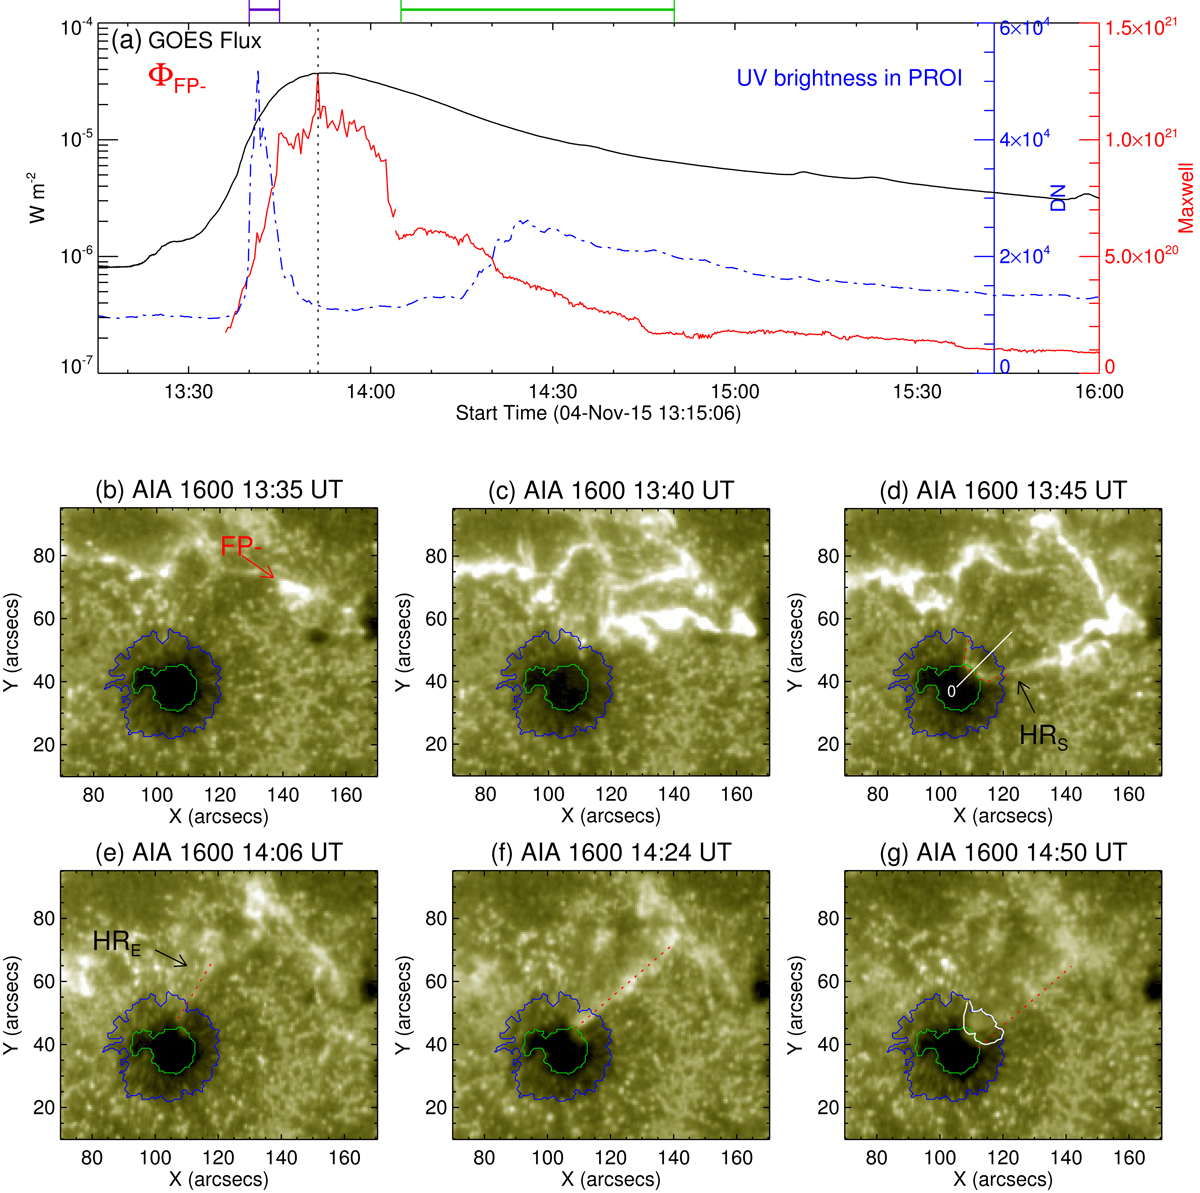
Evolution of the hooked ribbon enclosing the MFR foot FP−. Panel a shows lightcurves of GOES 1–8 Å flux (black; scaled by the left y-axis), magnetic flux through the MFR foot (red; scaled by the red y-axis on the right), and the mean brightness of the PROI in 1600 Å (blue; scaled by the blue y-axis on the right). The purple (green) bar on the top indicates the time interval during which the hooked ribbon sweeps through the PROI during the rope-buildup (erosion) stage. Panels b–g show snapshots of AIA 1600 Å images. The green (blue) contour marks the inner (outer) penumbral boundary. Red dashed lines outline sections of the hooked ribbon that move into the penumbra. The PROI as outlined by the red dashed line in panel d and the outer penumbral boundary is indicated by the white closed curve in panel g. The white line in panel d indicates a virtual linear slit adopted to make time-distance maps in Figs. 5 and 7, with “0” labeled as its starting point. The online animation shows AIA 1700, 1600, and 304 Å images during 13:00–16:00 UT, with panel a serving as a timeline reference.
Current usage metrics show cumulative count of Article Views (full-text article views including HTML views, PDF and ePub downloads, according to the available data) and Abstracts Views on Vision4Press platform.
Data correspond to usage on the plateform after 2015. The current usage metrics is available 48-96 hours after online publication and is updated daily on week days.
Initial download of the metrics may take a while.