Fig. 1.
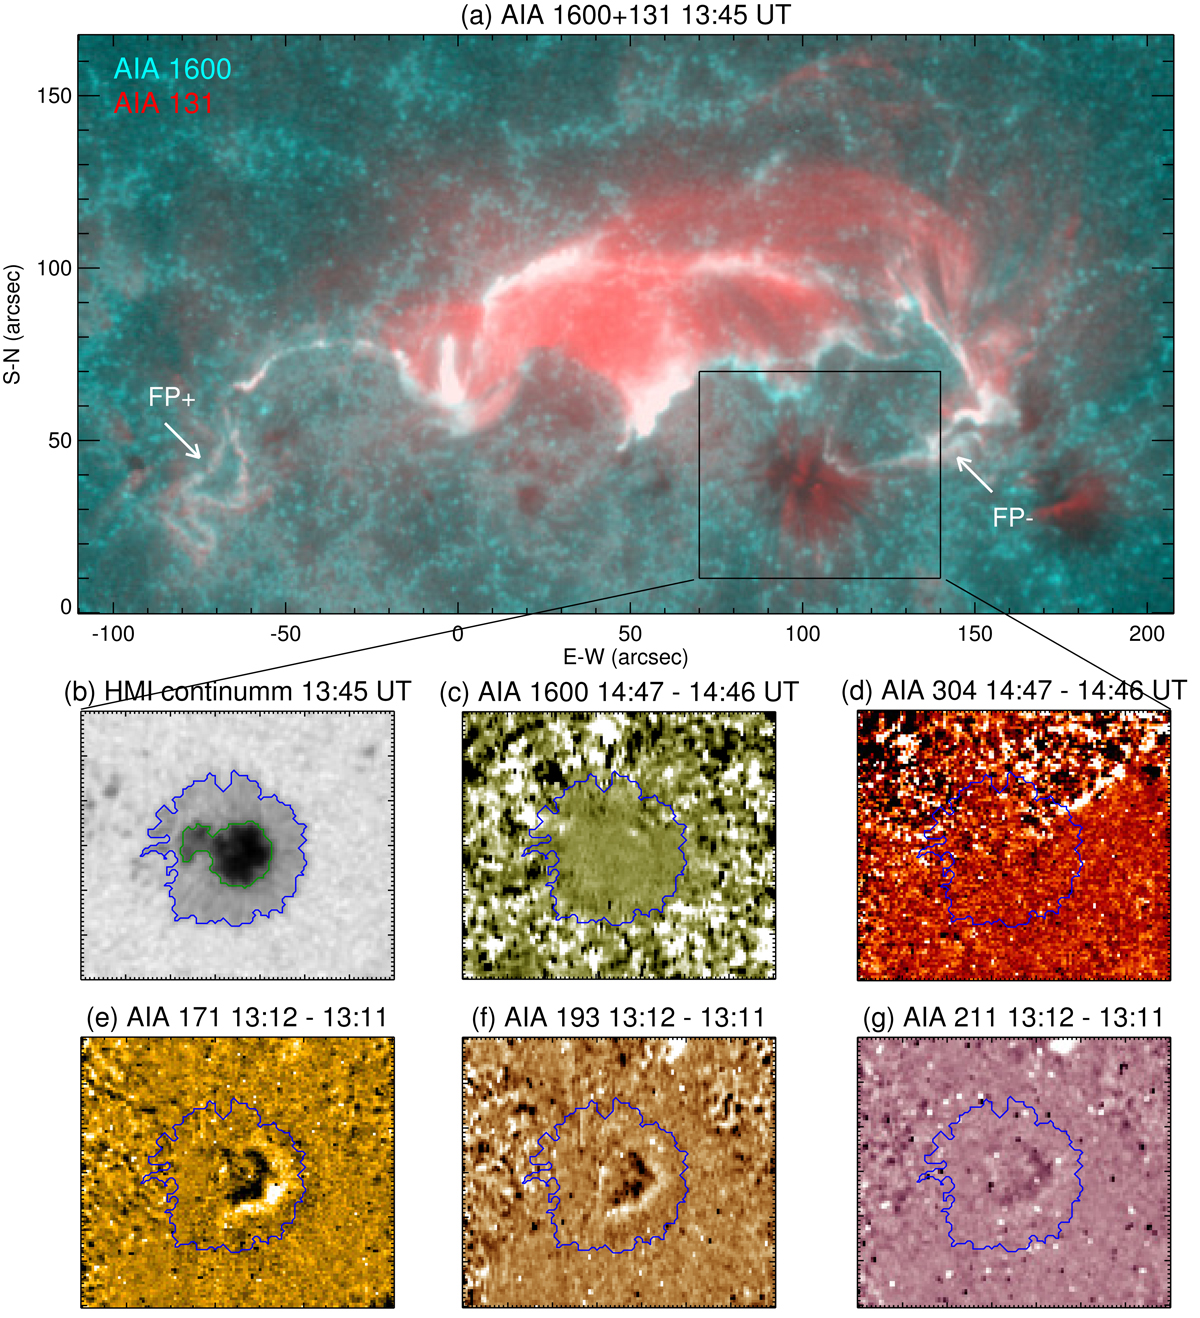
Flare ribbons in relation to the sunspot of interest. Panel a combines a 1600 Å (cyan) and a 131 Å (red) image to show the flare-ribbon morphology with two closed hooks attached to the far ends of two main ribbons. The MFR foot associated with negative (positive) polarity is labeled as FP− (FP+). Panels b–g zoom into the sunspot, with the field of view indicated by the rectangle in panel a. Panel b presents the sunspot observed by the HMI continuum, with the green (blue) contour marking the inner (outer) penumbral boundary. Panels c–g show the RPW fronts in difference images from various AIA passbands. Consisting of snapshots in the same format as the figure, the online animation shows the whole flaring process and the RPWs in the sunspot, covering the time period from 12:00 to 16:00 UT.
Current usage metrics show cumulative count of Article Views (full-text article views including HTML views, PDF and ePub downloads, according to the available data) and Abstracts Views on Vision4Press platform.
Data correspond to usage on the plateform after 2015. The current usage metrics is available 48-96 hours after online publication and is updated daily on week days.
Initial download of the metrics may take a while.