Fig. 3.
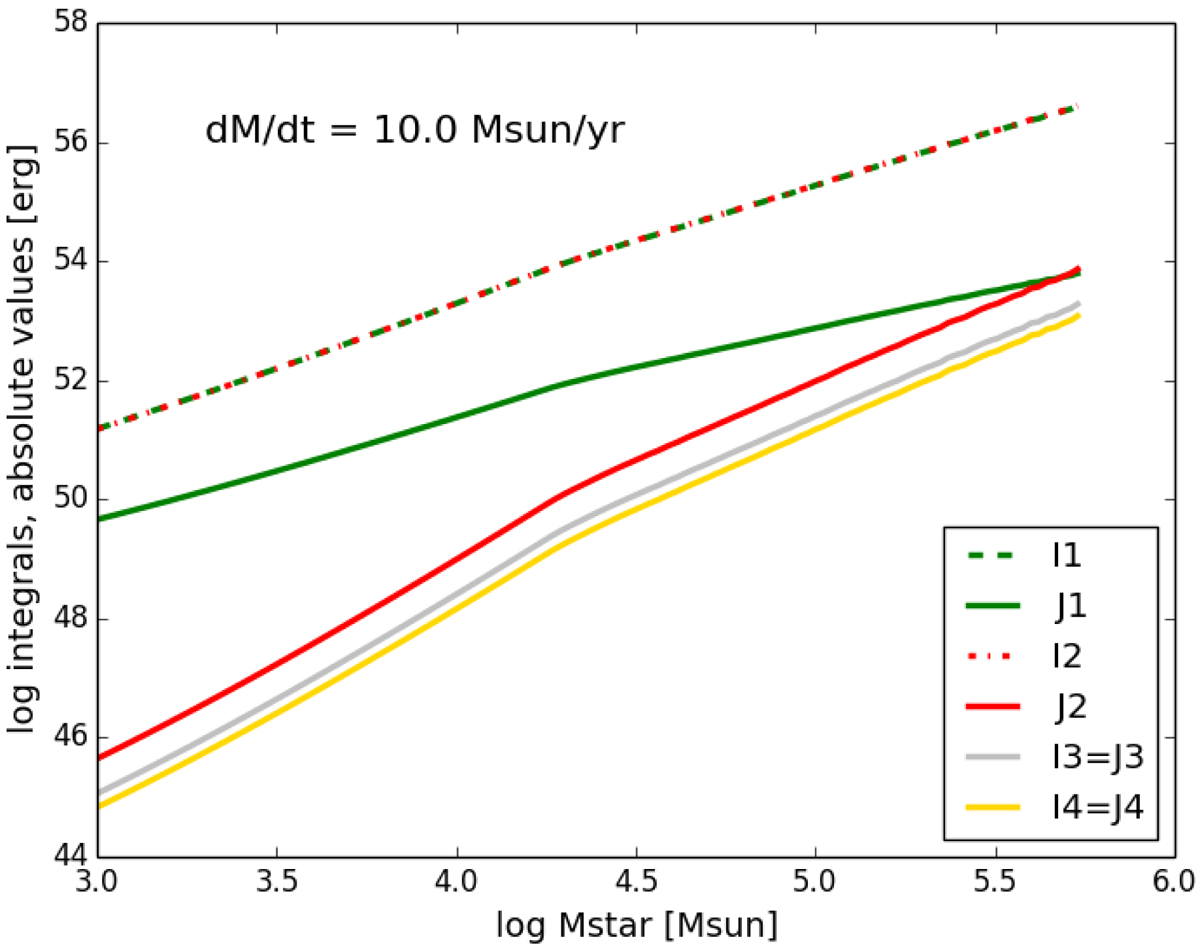
Absolute values of the integrals ((3)–(4), dashed lines) and ((12)–(15), solid lines) for the GENEC model at zero metallicity with the indicated rate. The green curves are the stabilising integrals I1, J1 > 0, while the red curves are the destabilising integrals I2, J2 < 0. The grey curves are I3 > 0 and I4 < 0, that remain negligible, and unchanged between Eqs. (1) and (11).
Current usage metrics show cumulative count of Article Views (full-text article views including HTML views, PDF and ePub downloads, according to the available data) and Abstracts Views on Vision4Press platform.
Data correspond to usage on the plateform after 2015. The current usage metrics is available 48-96 hours after online publication and is updated daily on week days.
Initial download of the metrics may take a while.