Free Access
Fig. 5
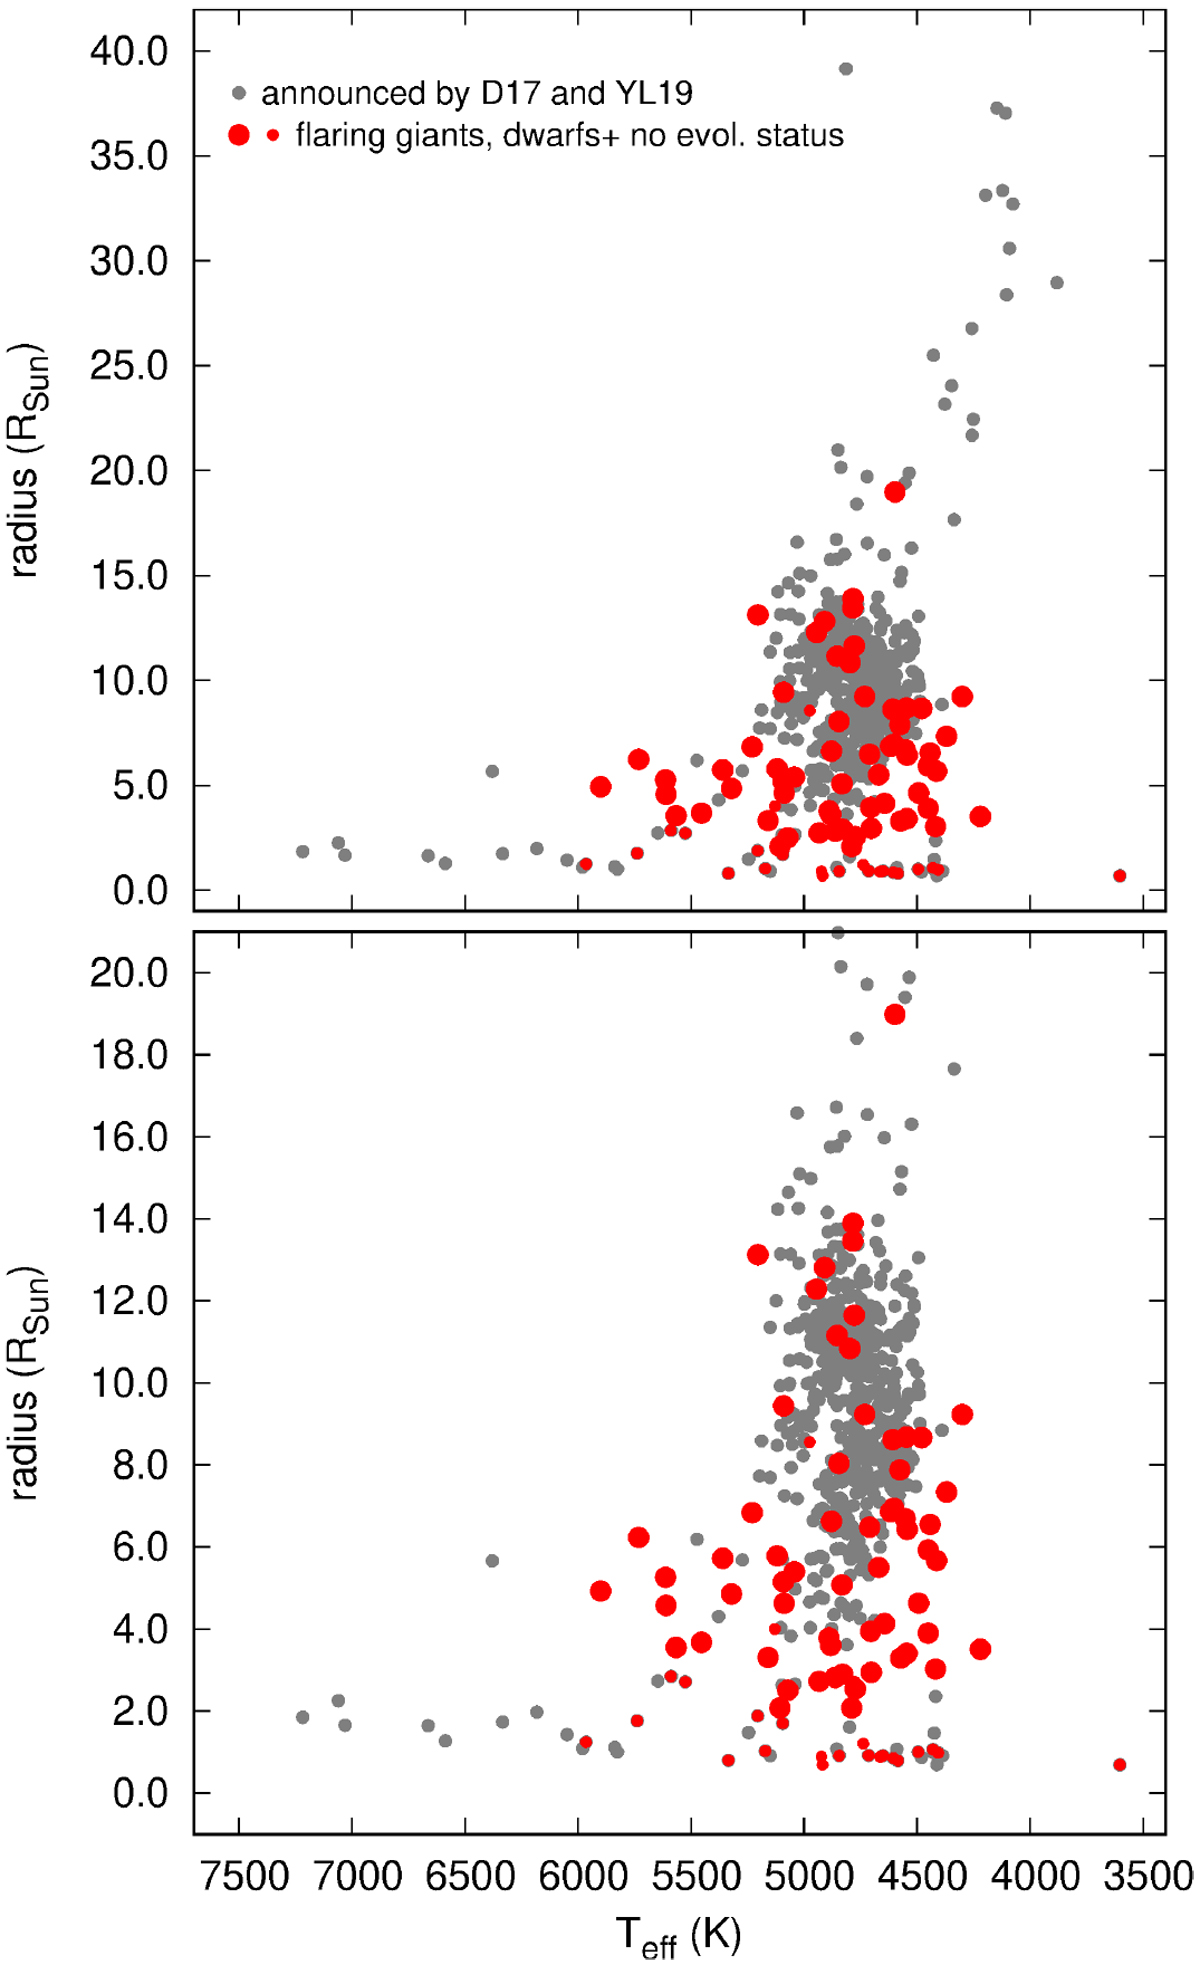
Radii of the flaring giants. Top: entire investigated sample. Bottom: enlarged region of radii. Gray dots represent the D17+YL19 giant sample, big red dots mark the flaring giants that are verified in the present paper, while small red dots represent the contaminating dwarfs and stars with unknown evolutionary status.
Current usage metrics show cumulative count of Article Views (full-text article views including HTML views, PDF and ePub downloads, according to the available data) and Abstracts Views on Vision4Press platform.
Data correspond to usage on the plateform after 2015. The current usage metrics is available 48-96 hours after online publication and is updated daily on week days.
Initial download of the metrics may take a while.