Fig. 16
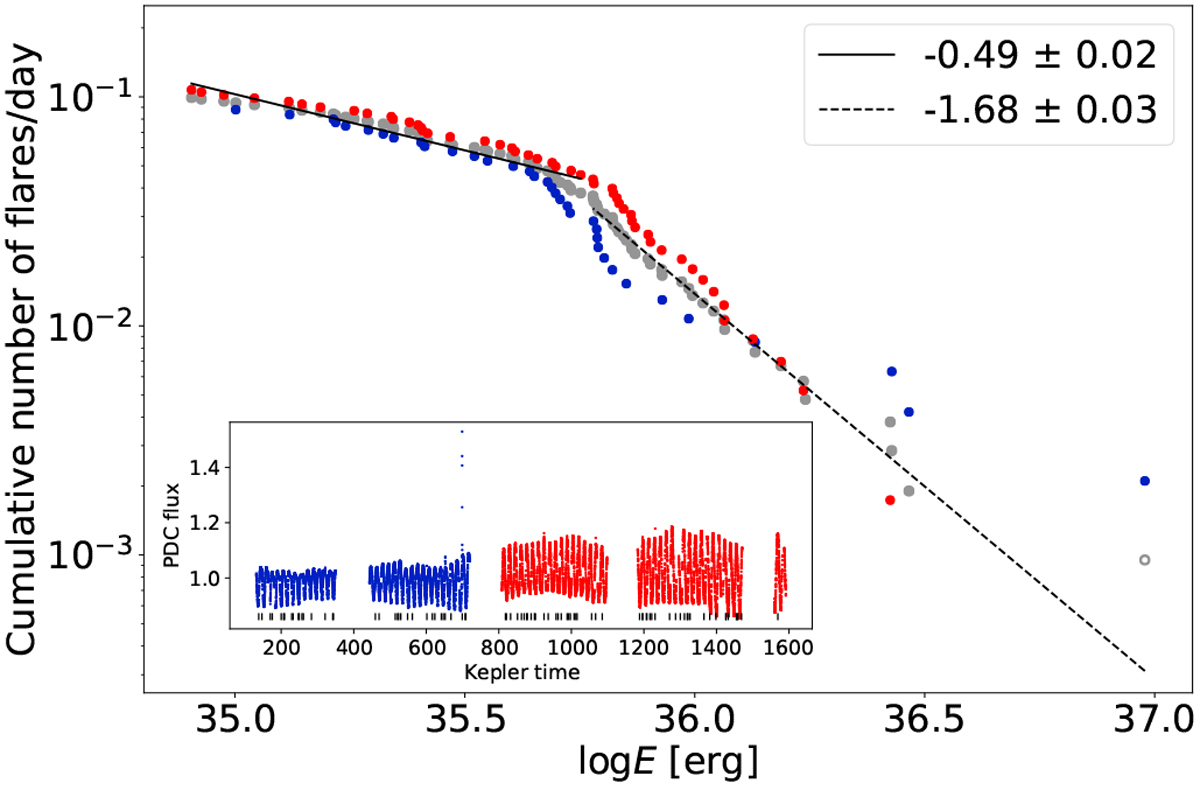
FFDfor KIC 7676676 in two activity levels. The data points showing lower and higher amplitude rotational modulation are marked with blue and red dots in the inset, and the same colors mark the corresponding FFDs. The broken power-law fit (gray line) corresponds to all the data (gray dots) shown in Fig. 15, upper panel. The highest amplitude flare occurred near the end of the lower amplitude rotational modulation. Flare energy values are derived for the Kepler bandpass.
Current usage metrics show cumulative count of Article Views (full-text article views including HTML views, PDF and ePub downloads, according to the available data) and Abstracts Views on Vision4Press platform.
Data correspond to usage on the plateform after 2015. The current usage metrics is available 48-96 hours after online publication and is updated daily on week days.
Initial download of the metrics may take a while.