Free Access
Fig. 10
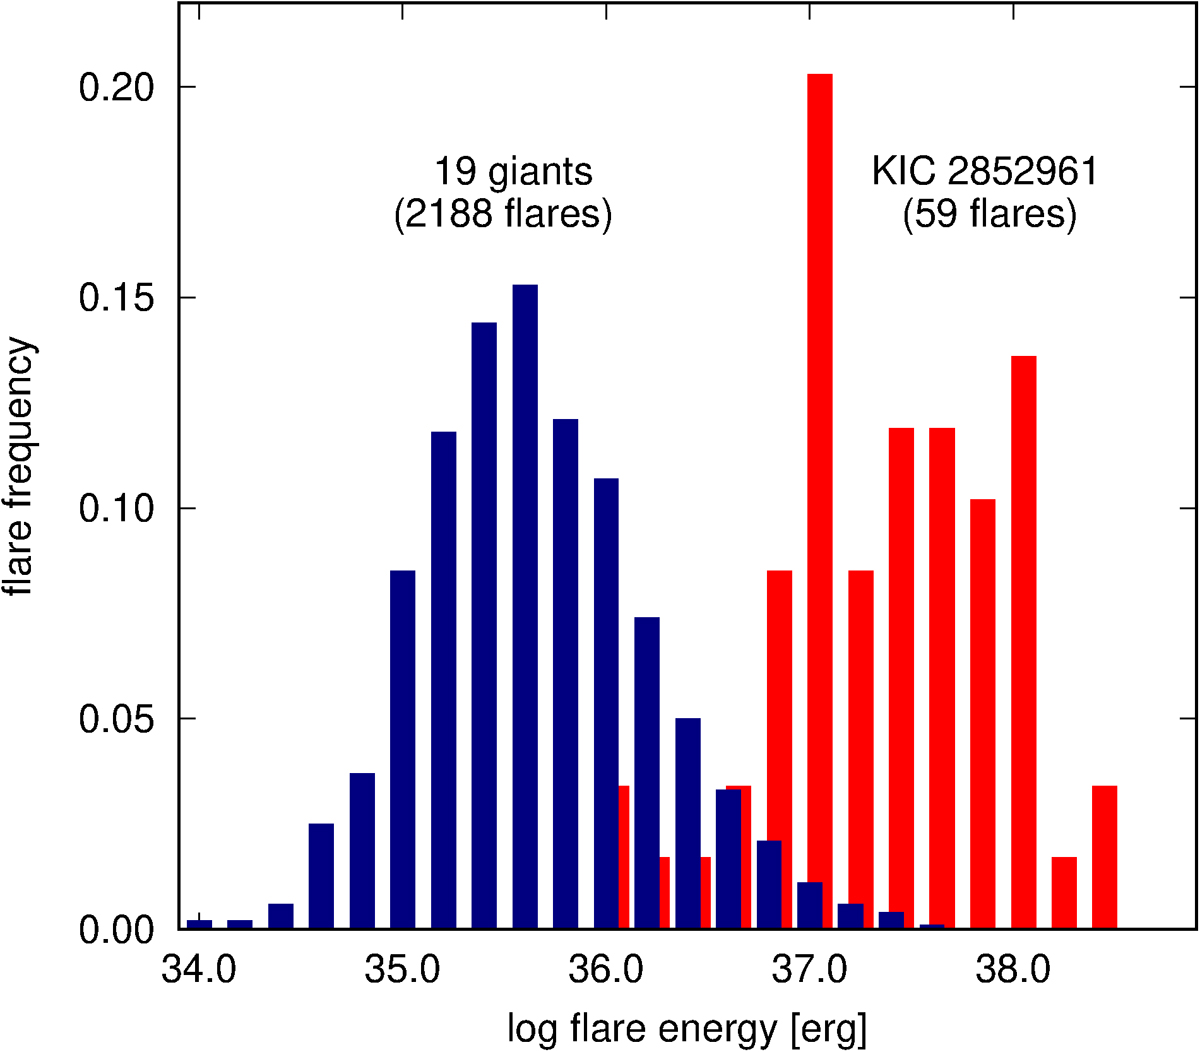
Comparison of combined distribution of flare energies in the Kepler bandpass of the most flaring 19 giants (dark blue columns) and that of KIC 2852961 (red columns; see also Fig. C.1).
Current usage metrics show cumulative count of Article Views (full-text article views including HTML views, PDF and ePub downloads, according to the available data) and Abstracts Views on Vision4Press platform.
Data correspond to usage on the plateform after 2015. The current usage metrics is available 48-96 hours after online publication and is updated daily on week days.
Initial download of the metrics may take a while.