Fig. 7
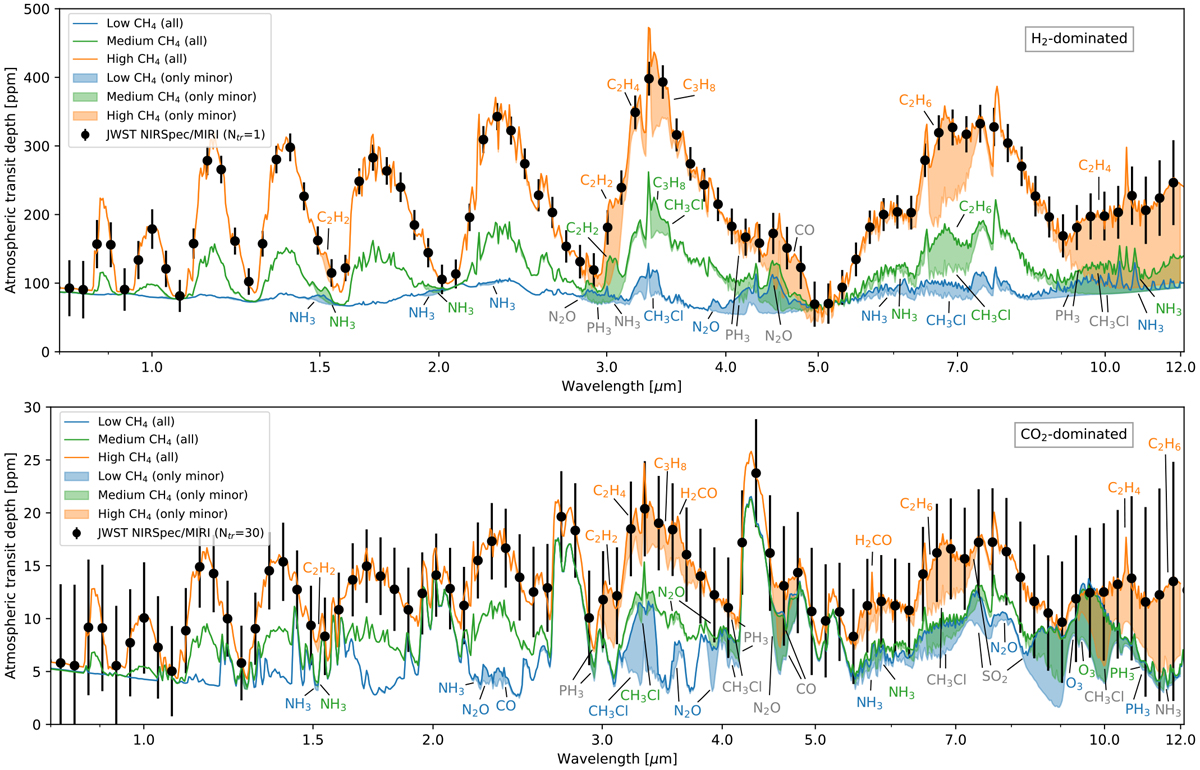
Simulated transmission spectra of LHS 1140 b with weak extinction from hazes in solid lines as shown in Fig. 5. Upper panel: H2-dominated atmosphereswith low, medium, and high CH4 concentrations corresponding to scenarios 1a (blue), 1b (green), and 1c (orange), respectively. Lower panel: CO2 -dominated atmosphereswith low, medium, and high CH4 concentrations corresponding to scenarios 10a (blue), 10b (green), and 10c (orange), respectively. The shaded region shows the contribution of the minor species to the full spectrum. Expected error bars for a single transit observation assuming scenario 1c (upper panel) and 30 co-added transits assuming scenario 10c (lower panel) using JWST NIRSpec PRISM (0.7–5 μm) and JWST MIRI LRS (5–12 μm), binned to R = 30. Strongest contribution of minor atmospheric molecular absorption bands are indicated by the color of the scenario or in gray when all scenarios have a significant contribution.
Current usage metrics show cumulative count of Article Views (full-text article views including HTML views, PDF and ePub downloads, according to the available data) and Abstracts Views on Vision4Press platform.
Data correspond to usage on the plateform after 2015. The current usage metrics is available 48-96 hours after online publication and is updated daily on week days.
Initial download of the metrics may take a while.