Fig. 6
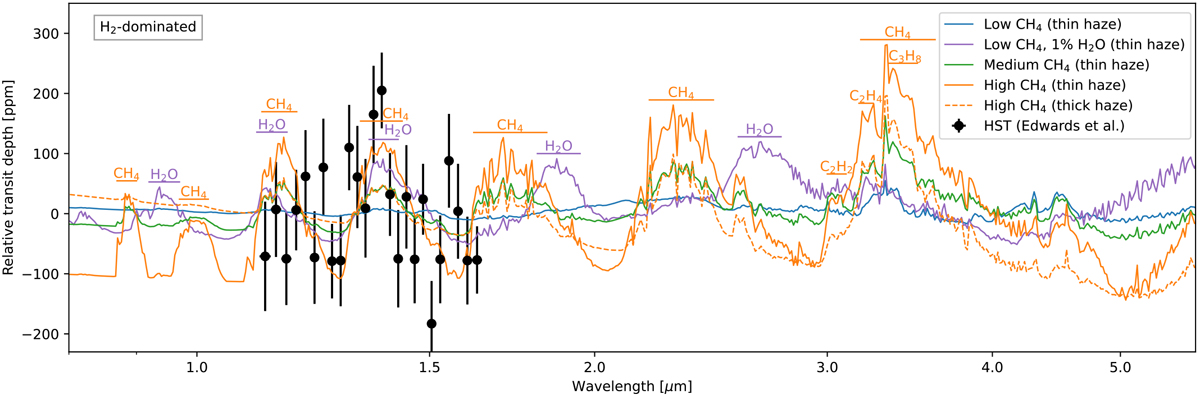
Simulated spectral features compared to HST observations taken from Edwards et al. (2021), assuming H2 -dominated atmospheres. The scenarios are color-coded: solid blue line for the low CH4 scenario (1a), as shown in Fig. 5, and solid purple line for scenario 1a, but with an assumed constant H2O mixing ratio of 1%; solid green line for the medium CH4 scenario (1b); solid and dashed orange lines for the high CH4 scenario (1c) with thin and thick hazes, respectively. All spectral data were binned to R = 300 and subtracted from the mean transit depth between 1.1 and 1.7 μm.
Current usage metrics show cumulative count of Article Views (full-text article views including HTML views, PDF and ePub downloads, according to the available data) and Abstracts Views on Vision4Press platform.
Data correspond to usage on the plateform after 2015. The current usage metrics is available 48-96 hours after online publication and is updated daily on week days.
Initial download of the metrics may take a while.