Fig. 3
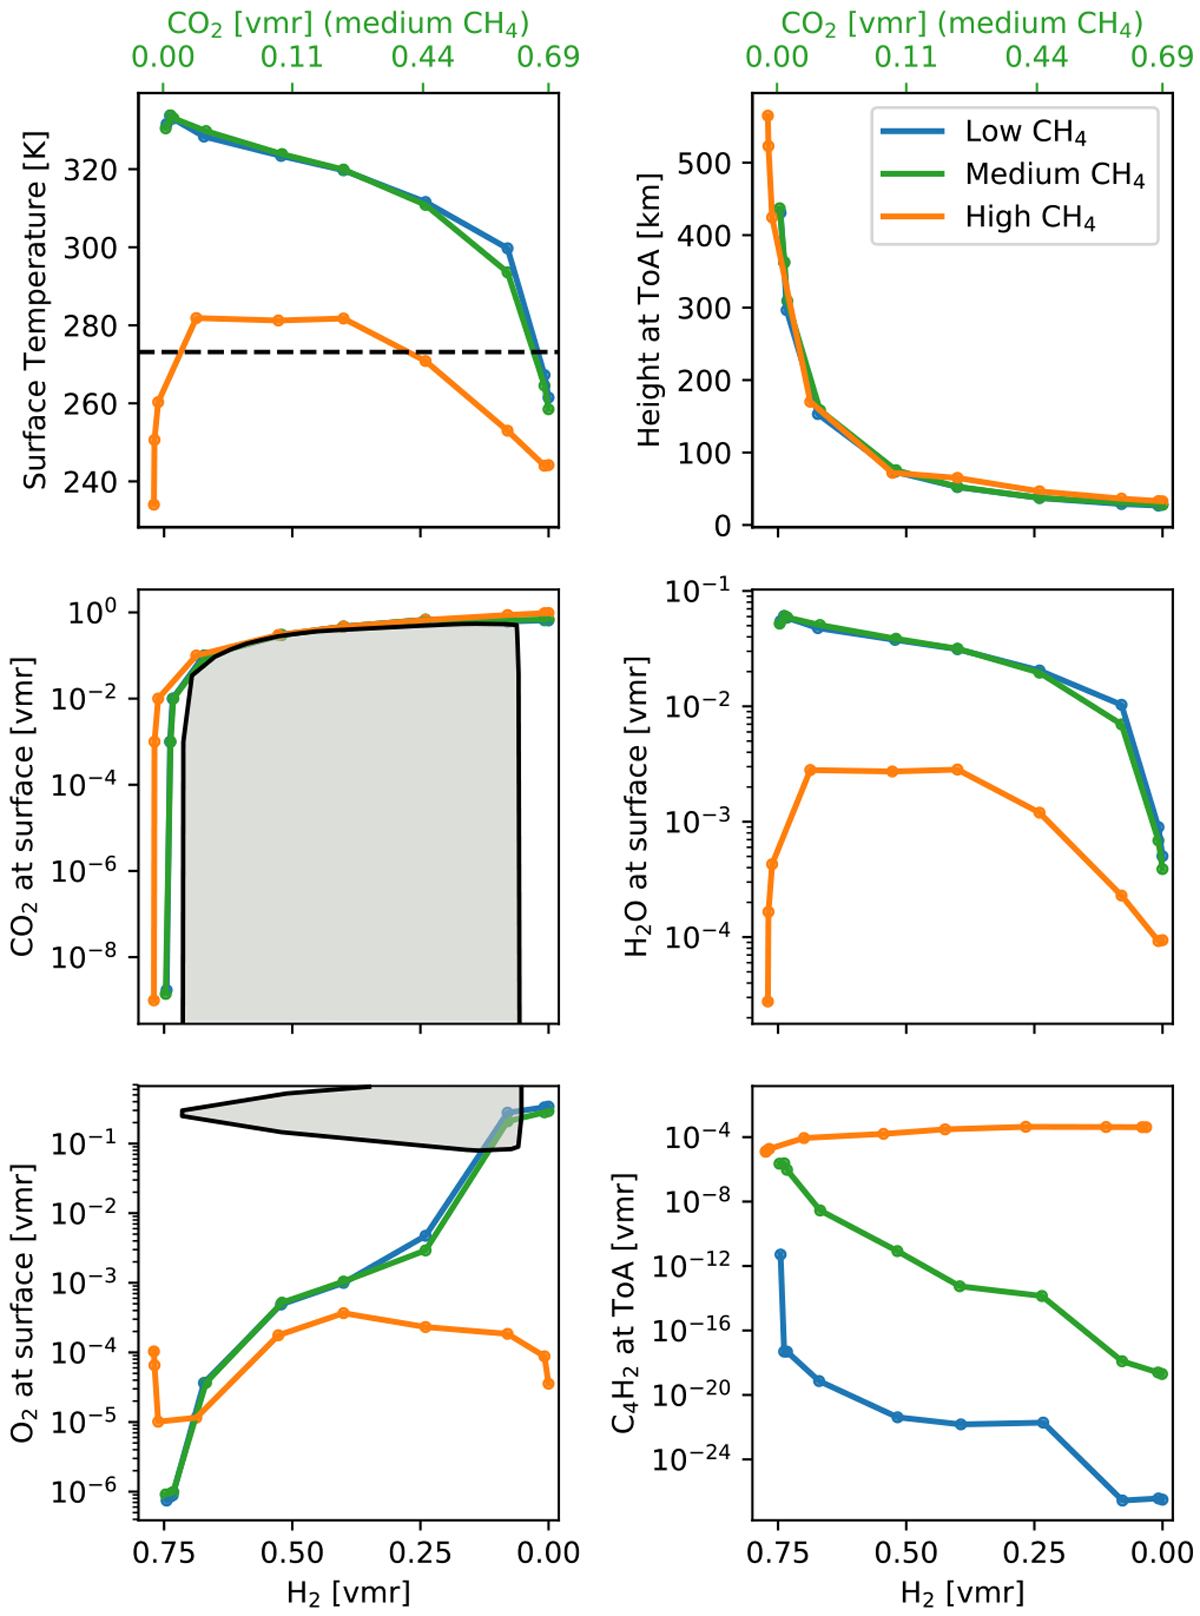
Change in surface temperature in K; in atmospheric height at ToA (~0.01 Pa) in km; and in surface volume mixing ratio (vmr) of H2O, O2, CO, and CH4 with decreasing concentrations of H2 for scenarios with low (blue lines), medium (green lines), and high CH4 scenarios. The concentrations of CO2 corresponding to H2 vmrs of 0.75,0.5, 0.25, and 0.0 are shown in green on the top x-axis for the medium CH4 scenarios. The colored dots represent the ten individual main scenarios described in Table 3. The dashed black line shows T = 273 K. The gray shaded region represents the limits of combustion for H2-CO2 and H2 -O2 gas mixtures (see Grenfell et al. 2018). The assumed surface mixing ratios of H2 and CO2 for the main scenarios 5–8 are at the edge of the H2-CO2 combustion limit.
Current usage metrics show cumulative count of Article Views (full-text article views including HTML views, PDF and ePub downloads, according to the available data) and Abstracts Views on Vision4Press platform.
Data correspond to usage on the plateform after 2015. The current usage metrics is available 48-96 hours after online publication and is updated daily on week days.
Initial download of the metrics may take a while.