Fig. 2
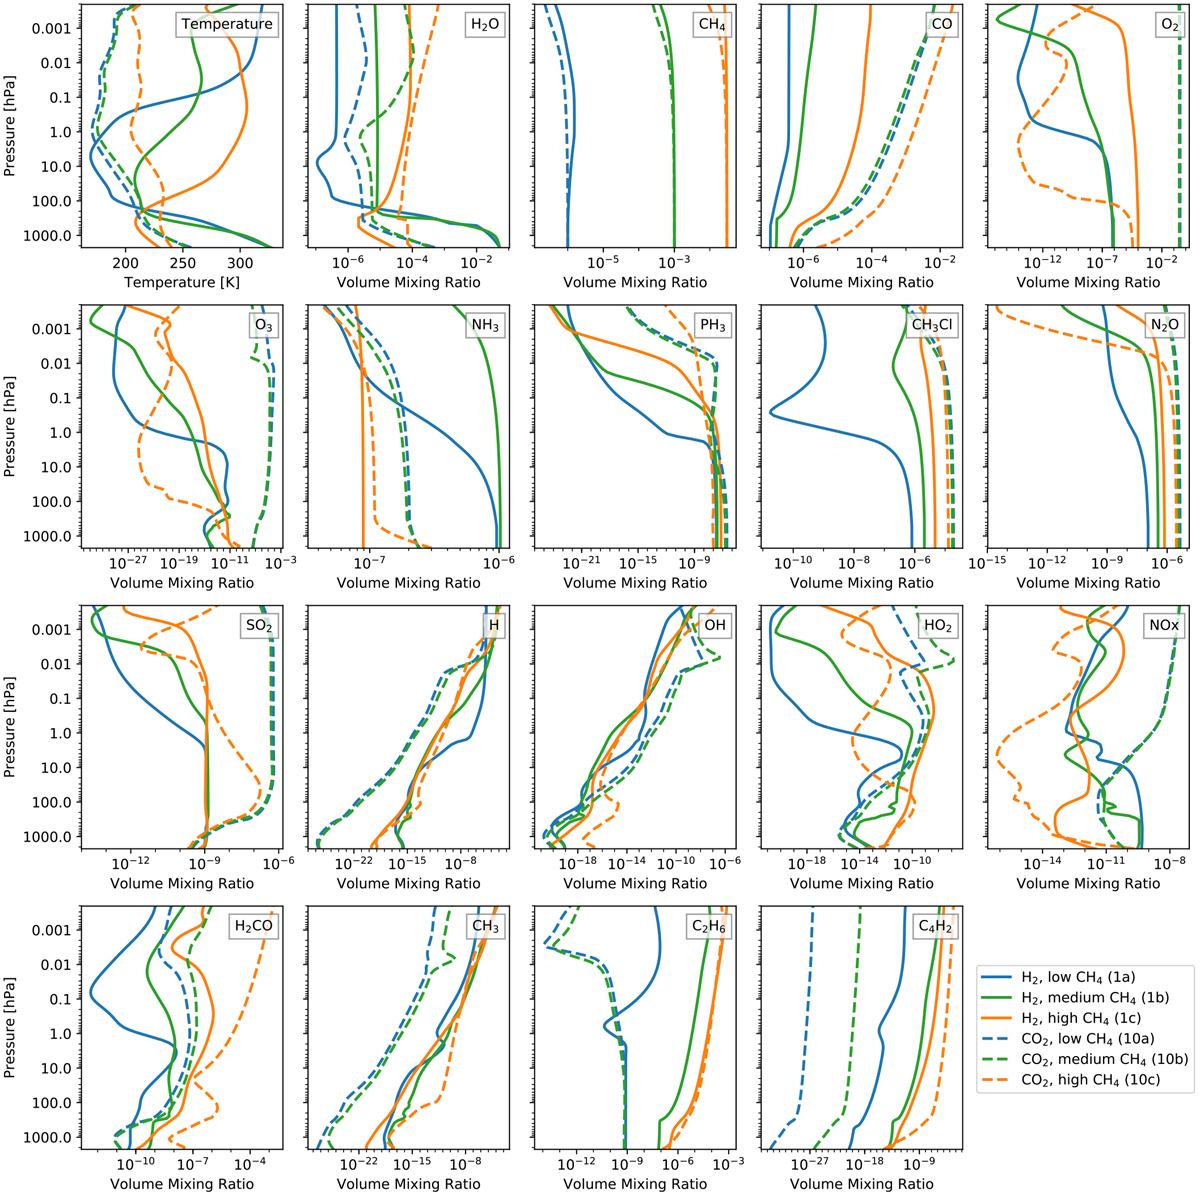
Simulated temperature and composition profiles of selected species of LHS 1140 b. Different colors represent the three types of scenarios considered: blue for low CH4, green for medium CH4, and orange for high CH4. The solid lines represent H2-dominated atmospheres(scenarios 1a, 1b, and 1c), whereas the dashed lines show CO2-dominated atmospheres(scenarios 10a, 10b, 10c).
Current usage metrics show cumulative count of Article Views (full-text article views including HTML views, PDF and ePub downloads, according to the available data) and Abstracts Views on Vision4Press platform.
Data correspond to usage on the plateform after 2015. The current usage metrics is available 48-96 hours after online publication and is updated daily on week days.
Initial download of the metrics may take a while.