Free Access
Fig. C.1
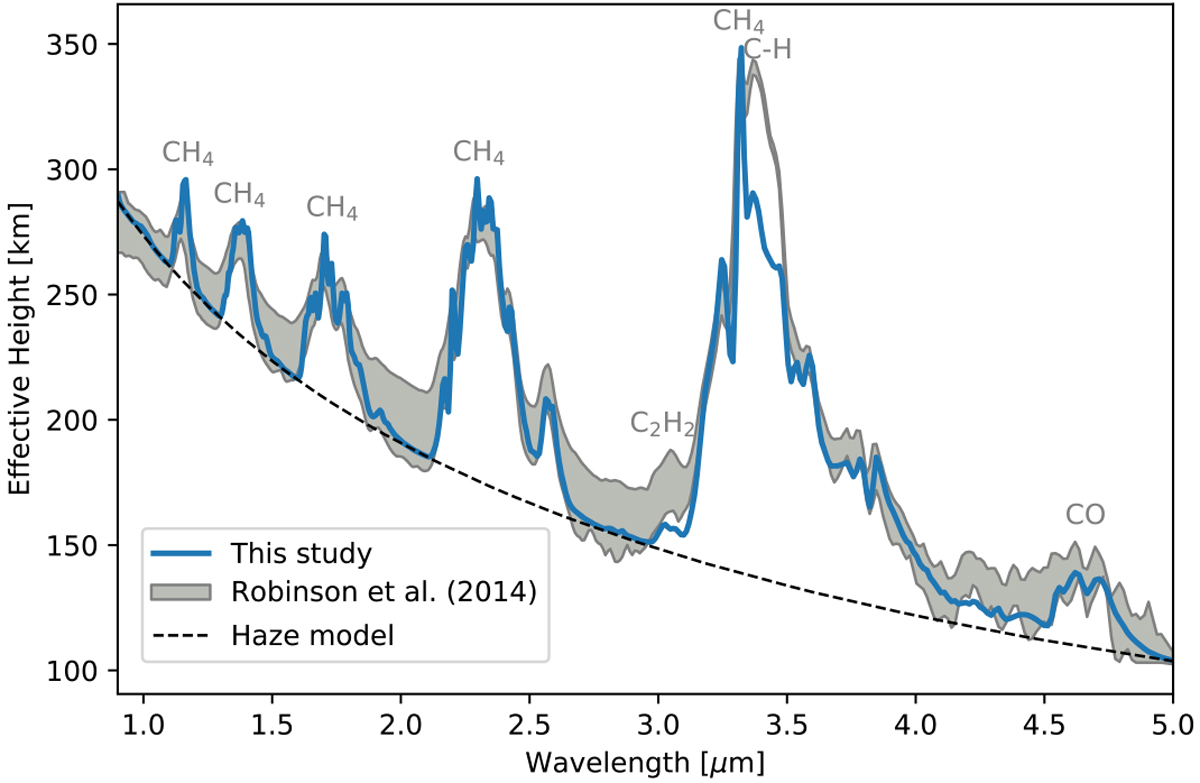
Transit transmission spectrum for Titan represented by effective height (in km, blue solid line). The shaded region indicates deviations from four individual transit spectra taken from Robinson et al. (2014). The black dashed line shows the best fit haze model.
Current usage metrics show cumulative count of Article Views (full-text article views including HTML views, PDF and ePub downloads, according to the available data) and Abstracts Views on Vision4Press platform.
Data correspond to usage on the plateform after 2015. The current usage metrics is available 48-96 hours after online publication and is updated daily on week days.
Initial download of the metrics may take a while.