Fig. 9.
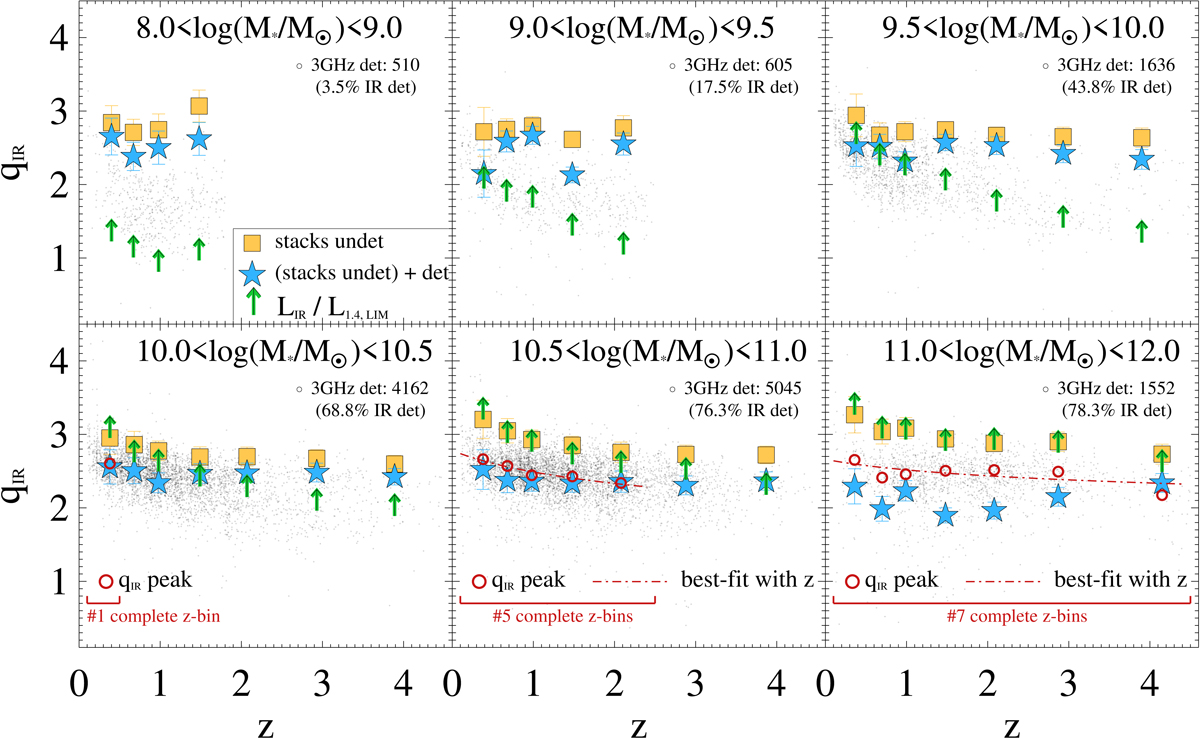
Distribution of qIR as a function of redshift, split across increasing M⋆ bins. In each panel, we compare the qIR estimates of individual radio detections (black dots) with the median stacked values of non-detections (yellow squares) and with the weighted-average qIR of detections and non-detections together (from Eq. (3), blue stars). Green upward arrows indicate the corresponding threshold qIR, lim above which radio detections become inaccessible from an M⋆-selected sample. We select relatively complete M⋆ − z bins, in which at least 70% of radio detections have qIR below the corresponding threshold. This criterion identifies 13 bins (in red square brackets). Within these bins, the peak of qIR distribution (qIR, peak) is indicated with red open circles. In the two highest M⋆ bins, the best fitting trends with redshift are shown by the red dashed lines. Each panel reports the number of individual 3 GHz sources and their fraction with S/NIR > 3. See Sect. 4.2.1 for details.
Current usage metrics show cumulative count of Article Views (full-text article views including HTML views, PDF and ePub downloads, according to the available data) and Abstracts Views on Vision4Press platform.
Data correspond to usage on the plateform after 2015. The current usage metrics is available 48-96 hours after online publication and is updated daily on week days.
Initial download of the metrics may take a while.