Fig. 8.
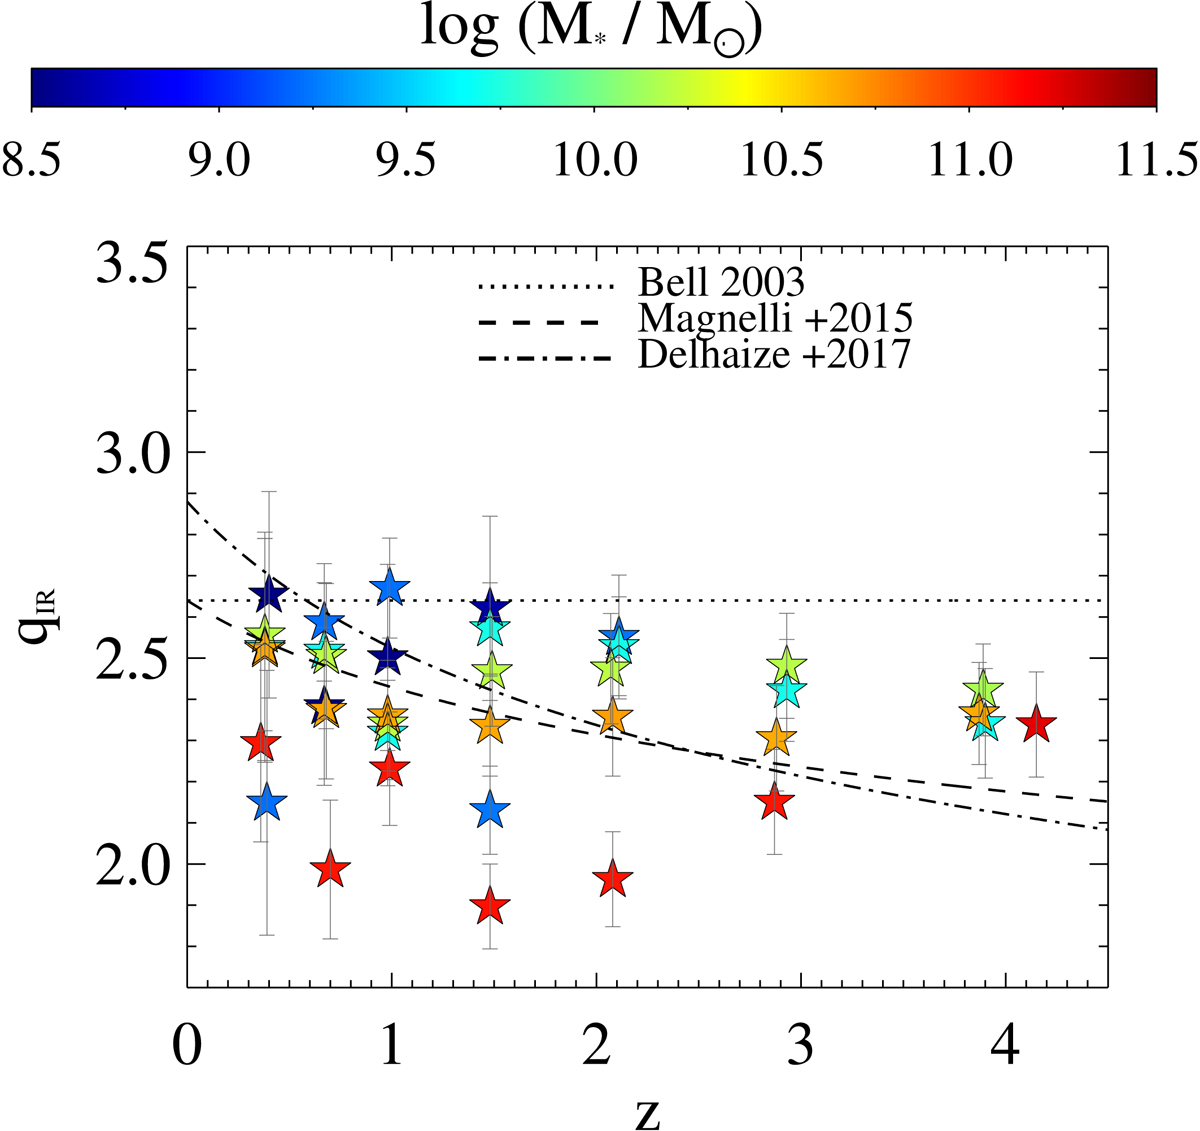
AGN-uncorrected qIR evolution as a function of redshift (x-axis) and M⋆ (colour bar). Errors on qIR represent the 1σ scatter around the median value, estimated via bootstrapping over LIR and L1.4 GHz. For comparison, other IRRC trends with redshift are taken from the literature (black lines): Bell (2003, dotted); Magnelli et al. (2015, dashed); Delhaize et al. (2017, dot-dashed). Our qIR values still include the contribution of radio AGN. See Sect. 4.1 for details.
Current usage metrics show cumulative count of Article Views (full-text article views including HTML views, PDF and ePub downloads, according to the available data) and Abstracts Views on Vision4Press platform.
Data correspond to usage on the plateform after 2015. The current usage metrics is available 48-96 hours after online publication and is updated daily on week days.
Initial download of the metrics may take a while.